# Chapter 1: The Political Economy of South Africa

## Learning Objectives

By the end of this chapter, you should be able to:

1. **Explain** how apartheid-era policies created enduring structural distortions in land ownership, spatial development, and human capital
2. **Analyse** the political economy constraints that shaped economic policy choices during and after the democratic transition
3. **Compare** and contrast the major economic policy frameworks (RDP, GEAR, ASGISA, NDP, Operation Vulindlela) in terms of their diagnoses, prescriptions, and outcomes
4. **Identify** the key institutions and actors in South Africa's economic policy-making ecosystem
5. **Assess** the interaction between growth, inequality, and unemployment as defining features of the contemporary economy

***

## I. Introduction: Setting the Stage

South Africa occupies a singular position in the global economy. It is Africa's most industrialised economy, with sophisticated financial markets, strong universities, and infrastructure that remains regionally significant despite deterioration. Its mineral endowment—platinum group metals, gold, coal, iron ore, manganese, and chrome—has shaped development for over a century. Its corporations operate across the continent, its constitutional framework is widely admired, and its central bank retains international credibility.

Yet South Africa remains one of the most troubling development puzzles of the contemporary era. Three decades after apartheid, official unemployment exceeds 32 percent—among the highest in the world outside active conflict (Statistics South Africa 2024). Its Gini coefficient of 0.63 makes it the most unequal society on earth by conventional measures (Statistics South Africa 2019; World Bank 2018).

> **32%** — South Africa's official unemployment rate, among the highest globally for a country not experiencing active conflict.

Economic growth has decelerated from early-2000s momentum to near-stagnation, averaging under 1 percent annually over the past decade (South African Reserve Bank 2024). Public infrastructure—most visibly electricity—deteriorated to crisis levels, with load shedding becoming routine before its unexpected resolution in 2025. The legacy costs of the infrastructure crisis, however, persist.

How did a country with such advantages arrive at such outcomes? What explains the persistence of extreme inequality despite substantial social transfers? Why has the formal economy failed to absorb the millions seeking work? And what pathways might lead toward more inclusive and sustainable growth?

These questions frame this chapter and the book. Our central argument is that South Africa's economic challenges cannot be understood apart from its political economy—the interplay of historical legacies, institutional configurations, distributional conflict, and policy choices that shape what is economically feasible and politically sustainable (Marais 2011; Habib 2013). Growth and distribution are not merely technical outcomes; they are products of contestation and compromise (Fine and Rustomjee 1996).

This chapter provides the foundation for the sectoral and thematic analyses that follow. It examines apartheid's economic legacies, the transition bargain and its constraints, and the evolution of policy frameworks from RDP through GEAR, ASGISA, NDP, and Operation Vulindlela. It then maps the policy ecosystem—Treasury, SARB, line departments, and consultative bodies—before assessing key outcomes and persistent constraints.

Throughout, we emphasise that South Africa's challenges, while severe, are not unique. Other middle-income countries have confronted similar dilemmas of structural transformation, inclusion, and state capability. Comparative perspective—drawing lessons from Chile's fiscal frameworks, Indonesia's industrial policy discipline, Kenya's digital public infrastructure, and other relevant cases—can illuminate both the constraints South Africa faces and the possibilities for reform. These comparative insights appear in policy boxes throughout the chapter and the book.

**Figure 1.1** presents the long-run trajectory of real GDP growth, illustrating the volatility and secular decline in growth performance that we seek to explain.

<figure><img src="/files/WRrsTrfieTeIDeDGpD3S" alt="Line chart showing South Africa&#x27;s real GDP level and growth rate from 1993-2024. The chart highlights 5% average growth during the commodity boom (2003-2008), the -6.2% COVID collapse in 2020, and subsequent decline to under 1% growth from 2015-2024."><figcaption><p><strong>Figure 1.1:</strong> Real GDP Level and Growth Rate. <em>Source: South African Reserve Bank, Stats SA.</em></p></figcaption></figure>

***

## II. The Shadow of Apartheid: Economic Legacies

To understand South Africa's contemporary economy, one must reckon with apartheid—not as distant history but as a structuring force still embedded in spatial patterns, assets, skills, and institutions (Terreblanche 2002; Seekings and Nattrass 2005). Apartheid (1948-1994) was not only a political regime of exclusion; it was an economic project that channelled resources and capabilities toward the white minority while constraining the black majority to cheap-labour roles (Lipton 1986; Wolpe 1988). These legacies became the inherited constraints of the democratic era.

### A. Segregation and Dispossession: The Spatial Economy

The economic geography of contemporary South Africa is incomprehensible without reference to the systematic dispossession of African land that began in the colonial period and was codified and intensified under apartheid (Feinstein 2005). The Natives Land Act of 1913—passed three years after the formation of the Union of South Africa—restricted African land ownership to approximately 7 percent of the country's territory (later expanded to 13 percent). This act, which Sol Plaatje memorably described as making Africans "pariahs in the land of their birth" (Plaatje 1916), initiated a century of displacement that fundamentally shaped settlement patterns, agricultural development, and wealth accumulation.

The Group Areas Act of 1950 extended segregation into cities through forced removals (Beinart and Dubow 1995). The destruction of Sophiatown, District Six, and many other neighbourhoods created apartheid's familiar urban form: white suburbs near economic centres and black townships on distant peripheries connected by costly commutes. Black South Africans were excluded from appreciating urban property markets and still face transport costs that absorb large household shares (Kerr 2017). This spatial mismatch remains a binding labour-market constraint (Banerjee et al. 2008).

The Bantustan system ("homelands") represented the apex of territorial segregation. Ten nominally self-governing territories were created, with four granted nominal "independence" unrecognised internationally. These areas were overcrowded, environmentally degraded, weakly serviced, and dependent on migrant remittances. They were labour reservoirs, not development sites.

The consequences remain visible in geographically disaggregated indicators (Statistics South Africa 2017). Former homeland areas, though reintegrated, still show poverty, unemployment, and service deficits far above national averages. Provinces with the largest homeland legacies—Eastern Cape, KwaZulu-Natal, and Limpopo—face structural challenges different in kind from Gauteng and the Western Cape (National Planning Commission 2012).

One of the most consequential and least discussed legacies of the 1913 Act is the bifurcation of land tenure systems that persists to this day. In "white" South Africa, freehold title was established on the European model, enabling land to function as collateral, to be mortgaged, subdivided, and traded in functioning property markets. In the former Bantustans, by contrast, land was held under communal or customary tenure administered by traditional authorities, a system that apartheid deliberately preserved and expanded to prevent African wealth accumulation outside the reserves (Cousins 2007). This distinction remains a major contemporary growth constraint: communal tenure inhibits agricultural investment because farmers cannot use land as collateral for credit, cannot easily transfer or lease plots to more productive users, and face uncertainty about long-term rights that discourages fixed improvements (Lahiff 2007). The result is that roughly 17 million South Africans living in former homeland areas are effectively locked out of the property-based wealth accumulation that has underpinned middle-class formation elsewhere in the country—connecting the 1913 Act directly to modern rural poverty, low agricultural productivity, and the spatial inequality documented throughout this book.

### B. Industrialisation under Apartheid: ISI and State Corporations

South Africa's industrialisation trajectory was shaped by three interacting forces: mineral wealth, import substitution policies, and the strategic imperatives of a regime under growing international isolation (Gelb 1991; Kaplan 2004). The result was an industrial structure that, while impressive in its scale and sophistication by African standards, was also distorted in ways that created lasting vulnerabilities.

The Minerals-Energy Complex (MEC)—a term coined by economist Ben Fine to describe the nexus of mining, energy, and related heavy industries (Fine and Rustomjee 1996)—dominated the apartheid-era economy. Cheap electricity from Eskom, itself built on cheap coal from mining conglomerates, powered energy-intensive industries: steel (ISCOR), aluminium (Alusaf), chemicals and synthetic fuels (SASOL), and minerals processing. These industries were capital-intensive rather than labour-intensive. They generated profits and tax revenues but relatively few jobs per unit of output. The MEC's political power—exercised through close relationships between mining houses, energy utilities, and the state—shaped economic policy in ways that privileged capital over labour, concentration over competition, and incumbents over entrants (Fine 1994).

**Post-1994 Financialisation and Capital Flight**: The MEC did not simply persist after democracy; it transformed in ways that compounded some of its adverse effects (Ashman and Fine 2013; Gillian Hart 2013; Mondliwa and Roberts 2022). As Mondliwa and Roberts argue, the political settlement around the democratic transition enabled corporate restructuring characterised by high profitability but low investment—power entrenchment in incumbent business groups undermined industrial policy and inclusive growth. The end of apartheid isolation coincided with the deregulation of capital controls, enabling the major mining and financial conglomerates—Anglo American, De Beers, Old Mutual, SABMiller—to shift their primary listings to London and New York. This "unbundling" represented a massive capital outflow: corporate headquarters, treasury functions, and decision-making authority followed the listings offshore. The conglomerate cross-holdings that had concentrated economic power in a few hands were unwound, but the proceeds often left South Africa as dividend repatriation or portfolio rebalancing (Mohamed 2010).

The capital-intensive, highly concentrated nature of MEC firms created an inherent centrifugal force that made capital flight structurally predictable rather than merely opportunistic. These conglomerates had outgrown the domestic market: their scale of operations demanded international liquidity, diversified shareholder bases, and access to global capital markets that the Johannesburg Stock Exchange—constrained by exchange controls and a small investor pool—could not provide (Mohamed 2010). Once capital controls were relaxed, the logic of global portfolio optimisation ensured that corporate treasuries, dividend flows, and strategic decision-making would follow primary listings offshore, prioritising global shareholders over domestic reinvestment.

The financialisation of the MEC also shifted its relationship to employment. Mining companies, facing rising costs and resource depletion, increasingly prioritised shareholder returns over production expansion (Gillian Hart 2013). Gold mining employment collapsed from over 400,000 to under 100,000 without any compensating growth strategy (Minerals Council South Africa 2023). Energy-intensive industries that had provided some employment contracted as electricity costs rose and global competition intensified. The MEC's historical role in accumulating capital was not replicated by a post-apartheid role in generating employment—the conglomerates extracted value rather than creating it domestically (Ashman and Fine 2013).

This transformation helps explain a puzzle: why did the end of apartheid, which should have expanded domestic markets through rising black incomes, not trigger an industrial boom? Part of the answer is that the MEC's dominant firms were oriented toward extraction and financialisation rather than serving domestic consumption. The unbundling released capital that largely exited rather than being reinvested in labour-intensive production. The MEC thus left a double legacy: a capital-intensive industrial structure poorly suited to absorbing labour, and a post-apartheid corporate sector oriented toward extraction of value rather than creation of employment. Dunne (2013) provides econometric evidence reinforcing this structural interpretation: the decline of manufacturing output has been causally linked to South Africa's growth slowdown, suggesting that the economy's failure to develop a diversified, labour-absorbing industrial base—rather than any single policy error—explains much of the post-apartheid growth disappointment. The misallocation extends beyond manufacturing neglect: Dunne and Uye (2010) show that military spending during the apartheid era crowded out productive investment, a pattern whose effects persisted into the democratic period as capital continued to flow toward rent-seeking and extraction rather than employment-generating sectors.

***

Import substitution industrialisation (ISI), pursued with particular intensity from the 1920s through the 1970s, created manufacturing capacity behind tariff walls (Amsden 2001). South Africa developed automotive assembly, consumer goods production, and engineering industries. However, the small domestic market—artificially constrained by the exclusion of the black majority from consumer markets—limited scale economies. Firms were often inefficient by global standards, surviving on protection rather than competitiveness (Kaplan 2004). When trade liberalisation came after 1994, many struggled to compete.

The international sanctions imposed from the 1960s onward accelerated the development of a distinctive state capitalism. SASOL's coal-to-liquids technology, Armscor's weapons manufacturing, and various other strategic industries were developed to ensure self-sufficiency in the face of isolation. This created pockets of genuine technological capability—South Africa's nuclear programme, for instance, was sufficiently advanced that the country produced nuclear weapons, subsequently dismantled. But it also created distortions: resources channeled to strategic industries could not go to labour-intensive manufacturing; skills developed for military purposes did not easily transfer to civilian applications; and the secrecy and opacity of strategic industries fostered governance practices inimical to accountability.

### C. The Dual Economy: Formal and Informal, Core and Periphery

The concept of economic dualism—the coexistence of "modern" and "traditional" sectors, or formal and informal economies—has a long and contested history in development economics. In South Africa, however, dualism was not merely an analytical construct but an explicit policy objective (Wolpe 1988). The apartheid state sought to maintain a "first world" white economy while consigning the black majority to a "third world" existence in the homelands and township peripheries.

The labour market was structured to enforce this dualism. Migrant labour systems brought African workers to mines and factories on temporary contracts, housed them in single-sex hostels, and returned them to homelands when no longer required (Wilson and Ramphele 1989). Pass laws criminalised urban presence outside contract terms. Job reservation reserved skilled occupations for white workers and blocked African advancement.

The consequences for human capital formation were severe. African education was deliberately underfunded and designed, in the notorious words of Hendrik Verwoerd (architect of apartheid and later prime minister), to prepare black South Africans for their "proper" place in society—that is, for unskilled labour. The Bantu Education Act of 1953 created a separate and inferior education system whose effects persist in contemporary skill deficits and education quality gaps (Fleisch 2008; Spaull 2013).

These dualities did not disappear after apartheid. The formal economy—with capital-intensive industries and a skilled core—employs only a fraction of the workforce. The informal sector, unlike in many developing countries, remains unusually small (ILO 2018). As Chapter 8 shows, it employs about 18 percent of workers, far below the 60+ percent typical at similar income levels (Statistics South Africa 2024). This "missing middle" in informal employment reflects barriers to entry, spatial constraints, and formal retail dominance (Kingdon and Knight 2004).

***

## III. The Democratic Transition: Hopes and Constraints

The negotiated end of apartheid (1990-1994) is rightly celebrated as a major political achievement (Thompson 2014). The transition avoided the civil conflict many expected, produced a constitution balancing civil and socioeconomic rights, and built democratic institutions that have proved comparatively durable despite later stress.

Yet the transition also established constraints—some explicit, others implicit—that shaped later possibilities for economic transformation (Bond 2000; Hirsch 2005). Understanding this settlement is essential for assessing subsequent policy choices and outcomes.

### A. The Negotiated Settlement: Political Miracle, Economic Continuity

The negotiations that ended apartheid were fundamentally political, focused on power transfer and constitutional democracy (Gumede 2005). Economic issues were present but secondary. The ANC entered with commitments to nationalisation and redistribution, while the National Party and business allies sought strong property-right guarantees against expropriation (Marais 2011).

The resulting settlement was a compromise. The property clause in the Constitution protects existing property rights but allows for expropriation in the public interest, subject to "just and equitable" compensation that balances multiple factors including the history of acquisition. The Constitution also establishes socioeconomic rights—to housing, healthcare, food, water, social security, and education—that impose positive obligations on the state, though these rights are subject to "progressive realisation" within "available resources."

What the transition did not produce was a binding economic-policy pact (Hirsch 2005). The new government inherited structural distortions along with debt, liabilities, and contractual commitments. The civil service remained largely intact, SARB independence was preserved, and property relations changed gradually. This continuity supported stability but constrained tools for radical transformation (Bond 2000).

### B. Expectations and Constraints: The Early Dilemma

The new government faced urgent and contradictory expectations (Habib 2013). Excluded majorities expected rapid gains in jobs, housing, services, and land. Domestic and international investors expected policy predictability, macroeconomic stability, and property-right protection. Organised labour expected wage and working-condition gains. International institutions pushed liberalisation and fiscal consolidation.

The macroeconomic inheritance made these tensions particularly acute. The apartheid government had increased spending in its final years—partly on security, partly on efforts to shore up support among white voters—while revenues declined amid recession and sanctions (Gelb 1991). Public debt had risen; the fiscal balance was negative. International reserves were depleted by capital flight. The currency was weak and unstable.

Moreover, the economy was in structural crisis (Nattrass 2001). Growth had slowed from the 1970s as the apartheid model—mining, protected ISI, and cheap black labour—ran out of scope. Total factor productivity growth was negative, investment rates were falling, and manufacturing was uncompetitive by global standards (Du Plessis and Smit 2007).

The new government thus faced a classic dilemma: how to expand social spending to meet urgent needs and democratic expectations while stabilising the macroeconomy to maintain investor confidence and create conditions for growth. Different actors within and around the government held different views on how to resolve this dilemma, and the evolution of policy over the following decades reflects these ongoing debates.

### C. Alliance Politics: ANC, COSATU, and SACP

The ANC-led government was not a unitary actor but an alliance of organisations with distinct constituencies and ideological orientations (Seekings and Nattrass 2005). The Congress of South African Trade Unions (COSATU), the largest trade union federation, represented organised workers in formal sector employment and advocated for policies that would protect wages, expand labour rights, and resist liberalisation measures that might threaten jobs. The South African Communist Party (SACP) provided ideological and organisational support to the ANC and generally favoured state-led development and redistribution.

The Tripartite Alliance, as this formation is known, has been both a source of strength and a constraint for the ANC in government (Habib 2013). It provides organisational capacity and mobilisation infrastructure. It also creates pressure for policies that protect formal sector workers—minimum wages, employment protection, regulated labour markets—that may conflict with employment creation for the unemployed. The insider-outsider dynamic in the labour market, explored in Chapter 8, reflects in part the political economy of an alliance in which the organised are more powerful than the unorganised (Banerjee et al. 2008).

Yet the Alliance also performed a stabilising function that deserves analytical recognition. By keeping COSATU within a governing coalition, the ANC prevented the emergence of an independent, more radical populist labour opposition for nearly two decades—a development that might have produced far more disruptive economic policy demands than those the Alliance generated internally (Seekings and Nattrass 2005). In this sense, the Alliance arguably provided the political floor for GEAR-era macroeconomic stabilisation: organised labour accepted monetary orthodoxy and fiscal consolidation, however grudgingly, in exchange for labour market protections and a seat at the policy table. COSATU's eventual fracture in 2014—when the metalworkers' union NUMSA was expelled, ultimately forming the SAFTU federation—suggests the limits of this containment strategy, but for the critical first two decades of democracy it channelled class conflict into institutional bargaining rather than street-level disruption.

### D. The Political Economy of Reform: Who Blocks, Who Benefits, and When Change Happens

The Alliance dynamics illustrate a broader pattern that shapes every policy domain examined in this book: reforms that would benefit diffuse majorities are frequently blocked by concentrated minorities whose losses would be immediate and visible (Olson 1965). Mapping these coalitions clarifies why economically sensible reforms—strengthening SOE governance, liberalising network industries, improving school accountability, simplifying small-business regulation—have proceeded so slowly despite broad consensus on their necessity (Habib 2013).

**Organised labour** (COSATU, SAFTU, and public-sector unions) blocks reforms that threaten formal-sector wage settings, employment protection, and collective bargaining arrangements. Their structural power is substantial: approximately 3.5 million union members have institutional voice through NEDLAC, the Alliance, and shop-floor organisation. The 8 million officially unemployed and roughly 5 million discouraged work-seekers, by contrast, are dispersed, lack institutional representation, and do not vote as a coordinated bloc. This asymmetry—insiders organised, outsiders atomised—is the labour market's defining political economy feature (Banerjee et al. 2008; Chapter 8).

**Connected capital**—firms and networks that benefited from procurement corruption, inflated SOE contracts, and preferential regulatory access during the state capture era—resists procurement reform, competitive tendering, and regulatory simplification that would expose previously sheltered positions to competition. The Zondo Commission documented these networks in detail; dismantling them requires not just prosecutorial action but structural reforms to procurement systems and SOE governance (Zondo Commission 2022; Chapter 3).

**Public-sector unions** constitute a distinct coalition from private-sector organised labour. They resist performance-based accountability, wage bill containment, and institutional reforms that would shift resources from compensation to service delivery. The public-sector wage bill, at approximately 35 percent of consolidated government expenditure, is both a fiscal constraint and a political reality: any attempt to reduce it mobilises a large, well-organised constituency with direct electoral influence (National Treasury 2026).

**Commercial agriculture** has resisted fast-track land redistribution, particularly models that would subdivide productive commercial farmland (Chapter 4). Their leverage derives from the sector's export earnings, food security contributions, and rural employment—legitimate economic concerns that also serve to protect incumbent land-ownership patterns.

Understanding these coalitions illuminates *when* reform happens despite resistance. South Africa's post-1994 experience suggests three enabling conditions:

First, **crisis severity** can override vested-interest opposition. The energy reform of 2021–2024 is the clearest example: Stage 6 load shedding imposed costs so visible and so widely shared—across firms, households, hospitals, and the political class itself—that opposition to private generation licensing collapsed. Business organised effectively (the BUSA Energy Task Force), technology costs had fallen (solar became cheaper than new coal), and crucially, the reform was *additive*—creating new generation capacity without redistributing existing rents. No incumbent lost their position; the market expanded (Chapter 3).

Second, **external compliance pressure** can create reform constituencies. South Africa's placement on the FATF grey list in 2023 threatened the financial sector's global integration—a cost that unified banks, insurers, and the Treasury behind rapid legislative reform. Removal from the grey list in February 2025 demonstrated that compliance-driven institutional reform can succeed when powerful domestic actors share the cost of inaction.

Third, **coalition realignment** can open policy windows. The 2024 GNU, whatever its durability, shifted the Overton window on several reforms—SOE restructuring, fiscal consolidation, regulatory simplification—that had been politically constrained within the Alliance framework. Whether this window remains open depends on whether the GNU can sustain cooperation on reforms whose costs are concentrated and whose benefits are diffuse.

These conditions have implications for the reform sequencing discussed in the Conclusion: reforms that are *additive* (expanding the pie), *crisis-driven* (costs of inaction exceed costs of change), or *externally reinforced* (international standards create domestic accountability) are more politically feasible than reforms that are *redistributive* (taking from organised groups to benefit unorganised ones). Energy and logistics reform fit the first template; labour market and land reform do not. Education reform—which has the highest long-run returns but the most dispersed benefits and the longest time horizons—is the hardest to sustain politically, precisely because its beneficiaries (today's children) cannot yet vote. This is not a counsel of despair but an analytical framework for understanding differential reform progress—and for identifying the political strategies that might overcome it.

***

## IV. Evolution of Economic Policy Frameworks

South Africa's post-apartheid policy has evolved through several frameworks, each responding to diagnosed problems with different remedies and each generating controversy (Hirsch 2005; Marais 2011). These were not clean ruptures—elements overlapped and persisted—but they did reflect shifting diagnoses of the growth and inclusion problem.

#### Policy Framework Timeline

<figure><img src="https://mermaid.ink/img/dGltZWxpbmUKICAgIHRpdGxlIFNvdXRoIEFmcmljYW4gRWNvbm9taWMgUG9saWN5IEV2b2x1dGlvbiAxOTk0LTIwMjQKICAgIHNlY3Rpb24gRGVtb2NyYXRpYyBUcmFuc2l0aW9uCiAgICAgICAgMTk5NCA6IFJEUCBsYXVuY2hlZCA6IERlbW9jcmF0aWMgZWxlY3Rpb25zCiAgICAgICAgMTk5NiA6IEdFQVIgYWRvcHRlZCA6IEZpc2NhbCBjb25zb2xpZGF0aW9uIGJlZ2lucwogICAgc2VjdGlvbiBHcm93dGggUGVyaW9kCiAgICAgICAgMjAwMSA6IEN1cnJlbmN5IGNyaXNpcwogICAgICAgIDIwMDMtMjAwNyA6IENvbW1vZGl0eSBib29tIDogNSUrIGdyb3d0aAogICAgICAgIDIwMDYgOiBBU0dJU0EgbGF1bmNoZWQKICAgIHNlY3Rpb24gQ3Jpc2lzIEVyYQogICAgICAgIDIwMDggOiBHbG9iYWwgZmluYW5jaWFsIGNyaXNpcyA6IExvYWQgc2hlZGRpbmcgYmVnaW5zCiAgICAgICAgMjAwOSA6IFp1bWEgYWRtaW5pc3RyYXRpb24gOiBTdGF0ZSBjYXB0dXJlIGJlZ2lucwogICAgICAgIDIwMTIgOiBORFAgYWRvcHRlZAogICAgICAgIDIwMTUgOiBOZW5lZ2F0ZSBjcmlzaXMKICAgIHNlY3Rpb24gUmVmb3JtIEF0dGVtcHRzCiAgICAgICAgMjAxOCA6IFJhbWFwaG9zYSBwcmVzaWRlbmN5IDogWm9uZG8gQ29tbWlzc2lvbiBiZWdpbnMKICAgICAgICAyMDIwIDogQ09WSUQtMTkgcGFuZGVtaWMgOiBPcGVyYXRpb24gVnVsaW5kbGVsYSBsYXVuY2hlZAogICAgICAgIDIwMjIgOiBTdGFnZSA2IGxvYWQgc2hlZGRpbmcKICAgICAgICAyMDI0IDogR05VIGZvcm1hdGlvbgo" alt="South African Economic Policy Evolution 1994-2024"><figcaption><p><em>
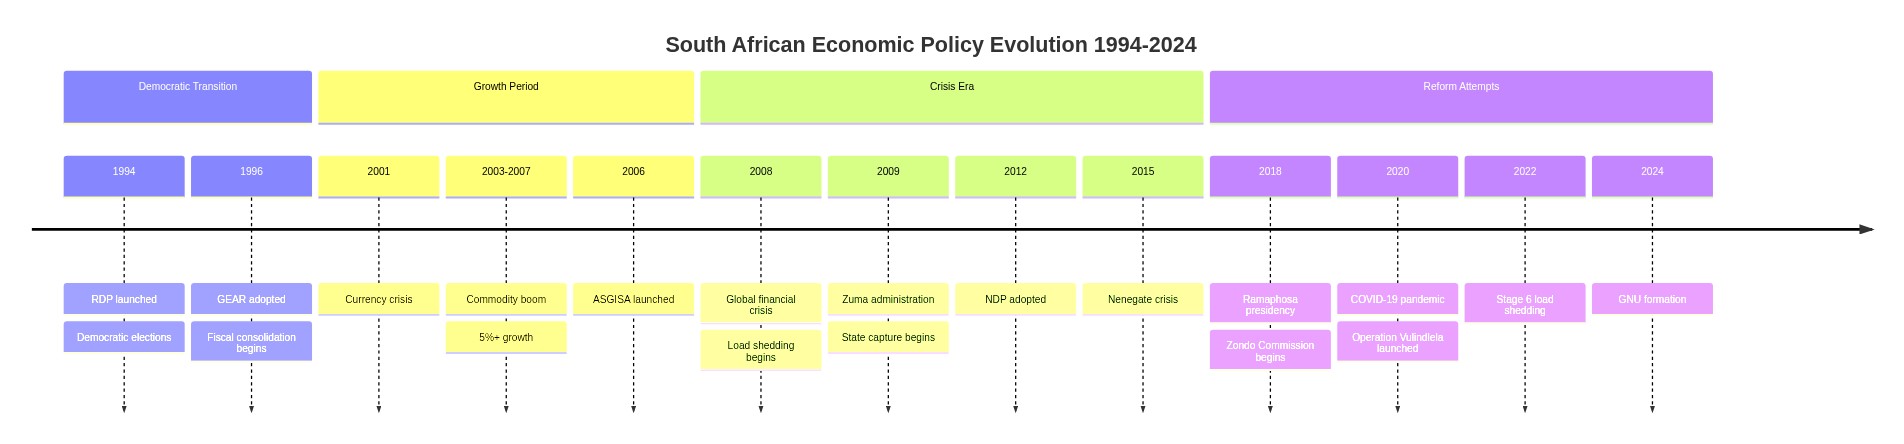
Policy timeline showing the evolution from RDP through GEAR, the crisis era, and reform attempts.</em></p></figcaption></figure>

*The timeline shows how South Africa's policy frameworks evolved in response to changing economic conditions and political contexts, from the optimism of the RDP era through state capture to current reform efforts.*

### A. The Reconstruction and Development Programme (RDP, 1994)

The RDP was the ANC's 1994 electoral platform and, briefly, the organising framework of early democratic economic and social policy (African National Congress 1994). It reflected broad Alliance and civil-society input and advanced a "people-centred" strategy to meet basic needs while building the economy and democratising the state.

The RDP identified five key programme areas: meeting basic needs (housing, water, electricity, healthcare, education); developing human resources; building the economy; democratising the state and society; and implementing the RDP itself. It called for massive investment in infrastructure and services, job creation through public works, and land reform. It also committed to macroeconomic stability, explicitly noting that "reckless spending" would undermine development objectives (African National Congress 1994, 78).

An RDP Ministry was established under Minister Jay Naidoo, and an RDP Fund was created to channel resources to priority programmes. Early achievements included the extension of basic services—clean water and electricity reached millions of households—and the initiation of a public housing programme that, despite its limitations, would eventually deliver over four million houses.

However, the RDP as a coordinating framework proved short-lived. The RDP Ministry was closed in 1996 and its functions dispersed to line departments. Explanations differ—weak coordination, Treasury preference for a different approach, and internal political conflict—but in practice RDP gave way to GEAR.

### B. Growth, Employment and Redistribution (GEAR, 1996)

GEAR represented a major policy shift—controversial then and now (Bond 2000; Hirsch 2005). Announced in June 1996 as a "non-negotiable" macro strategy, it was developed mainly within Treasury and SARB with limited Alliance input (Department of Finance 1996). Its diagnosis was that macro stabilisation and structural reform were preconditions for investment-led growth, with redistribution following growth.

GEAR's prescriptions included: fiscal deficit reduction (targeting a deficit of 3 percent of GDP by 2000); inflation reduction through monetary policy; trade liberalisation (accelerating tariff reductions already committed under WTO accession); privatisation or restructuring of state assets; labour market flexibility; and exchange rate liberalisation (though the rand's collapse in 1996, following the initial announcement, complicated this).

The strategy set explicit targets: 6 percent growth by 2000, 400,000 jobs annually, and higher fixed investment. These were not met (Du Plessis and Smit 2007). Growth averaged about 2.5 percent in the late 1990s, formal employment declined, and investment remained weak. Critics, including COSATU and the SACP, argued that GEAR prioritised orthodoxy over employment and redistribution (Bond 2000; Marais 2011).

Defenders contend that GEAR met core objectives: fiscal stabilisation, lower inflation, and conditions for the 2000s growth phase (Hirsch 2005). They argue the counterfactual—continued deterioration and instability—could have produced a deeper crisis.

**Figure 1.2** shows the trajectory of gross fixed capital formation as a share of GDP, illustrating the investment dynamics that all these policy frameworks sought to influence.

<figure><img src="/files/rOePqaz7cJqJ514QlAj2" alt="Line chart showing Gross Fixed Capital Formation as percentage of GDP from 2000-2023. Investment peaked at 21.6% in 2008 before the global financial crisis, declined steadily to 13.7% by 2020, with only partial recovery since."><figcaption><p><strong>Figure 1.2:</strong> Gross Fixed Capital Formation (% of GDP). <em>Source: World Bank, SARB.</em></p></figcaption></figure>

### Why Investment Collapsed — and What Would Reverse It

The trajectory in Figure 1.2 is worth pausing on, because investment collapse is both a symptom and a cause of South Africa's growth failure. At 21.6 percent of GDP in 2008, GFCF was approaching the 25 percent threshold that development economists associate with sustained growth acceleration (Commission on Growth and Development 2008). By 2020 it had fallen to 13.7 percent—among the lowest rates in the emerging-market peer group and well below the levels needed to replace depreciating infrastructure, let alone expand productive capacity.

**Figure 1.8** disaggregates the collapse into its public and private components, revealing two distinct stories.

<figure><img src="/files/UJlSh2Ant0TqyfSm68i8" alt="Dual line chart showing public GFCF collapsing from 7.8% of GDP in 2008 to 3.0% in 2024, while private GFCF declined more modestly from 13.8% to around 11%, illustrating that the investment collapse was primarily driven by the public sector."><figcaption><p><strong>Figure 1.8:</strong> The Investment Collapse: Public vs Private GFCF (% of GDP), 2000–2024. <em>Source: SARB Quarterly Bulletin; National Treasury Budget Review. Public investment peaked with World Cup infrastructure and collapsed as SOE bailouts consumed fiscal space. Private investment never recovered from the GFC.</em></p></figcaption></figure>

**Public investment** peaked at nearly 8 percent of GDP in 2008, driven by World Cup infrastructure, Eskom's Medupi and Kusile build programme, and Transnet's expansion plans. It has since halved to around 3 percent. The proximate cause is fiscal: SOE bailouts exceeding R240 billion for Eskom alone (Chapter 3), combined with rising debt service—now consuming approximately 20 cents of every rand collected—have crowded out capital expenditure. Each rand spent servicing debt or bailing out dysfunctional enterprises is a rand unavailable for roads, schools, water treatment plants, and digital infrastructure. Public investment is now too low to maintain existing infrastructure, let alone expand it. The consequence is a self-reinforcing deterioration: underinvestment degrades infrastructure quality, which raises costs for firms and households, which reduces growth, which further constrains fiscal space for investment (Gillingham 2024; National Treasury 2026).

**Private investment** tells a more subtle story. It fell from 13.8 percent of GDP in 2008 to about 10 percent during the state capture years and has recovered only partially. South Africa presents a puzzle for private investors: the country has strong legal institutions—an independent judiciary, a credible central bank, a sophisticated financial sector, and a globally integrated stock exchange (Chapter 7)—that should attract capital. Yet private fixed investment consistently underperforms relative to these institutional strengths.

The explanation lies in the accumulation of deterrents that raise the effective cost of capital and shorten investment horizons (Fedderke and Romm 2006; IMF 2023). **Energy unreliability** was the most visible constraint through 2024: firms that cannot guarantee production schedules cannot commit to capital expenditure. **Logistics bottlenecks** at ports and on rail raise input and export costs, reducing the return on manufacturing and mining investment (Chapter 3). **Regulatory inconsistency**—successive revisions to the Mining Charter, shifts in BEE requirements, and policy reversals on expropriation—generates uncertainty that discourages the long-horizon commitments that fixed investment requires (Chapter 5). **Crime and public safety** impose direct security costs and indirect costs through skilled emigration (Chapter 9). And the **sovereign risk premium**, which widened sharply after the 2017 ratings downgrades, raises the cost of borrowing for all South African firms, not just the government.

The foreign direct investment picture compounds the puzzle. South Africa attracted an annual average of less than 2 percent of GDP in FDI between 2010 and 2023—well below comparable emerging markets such as Vietnam (6 percent), Indonesia (2.5 percent), and even Brazil (3 percent) (UNCTAD 2024). Portfolio investment, while substantial given the JSE's size, is inherently more volatile and does not build productive capacity.

Yet the energy reform experience offers a proof of concept for reversal. When the government raised the licensing threshold for embedded generation in 2021 and accelerated REIPPPP bid windows, private renewable energy investment surged—exceeding R100 billion in committed projects within three years (DMRE 2024). This demonstrates a critical insight: when binding constraints are relaxed, private capital responds rapidly. The question is whether the energy precedent—where reform was *additive* (creating new generation capacity) rather than *redistributive* (taking from incumbents)—can be replicated across other constraints. Logistics reform, where Transnet's third-party rail access framework is being developed, may follow a similar template. Labour market and land reform, where gains for some imply costs for others, will be harder.

The investment collapse is therefore not a puzzle without solutions but a constraint whose relaxation depends on progress across the other binding constraints examined in this book—energy (Chapter 3), logistics (Chapter 3), state capacity (Chapter 3), human capital (Chapter 9), and the regulatory and political environment examined throughout. This interconnection—constraints binding because they reinforce one another—is the framework's central insight, and the investment deficit is where all constraint failures ultimately converge.

#### Comparative Policy Box: Brazil's Post-Authoritarian Economic Reform

Brazil's transition from military rule (1985) offers instructive parallels to South Africa's post-apartheid trajectory. Both countries inherited deeply unequal economies from authoritarian predecessors, both adopted new constitutions with expansive social rights, and both faced the tension between redistribution and macroeconomic stability.

Brazil's initial post-transition decade was marked by economic instability—hyperinflation peaked at nearly 2,500% in 1993—before the *Plano Real* (1994) stabilised the currency and established a foundation for growth. Like South Africa's GEAR, the Real Plan combined fiscal discipline with market-oriented reforms, drawing criticism from the left for prioritising stabilisation over redistribution (Baer 2014). Under President Lula (2003-2010), Brazil demonstrated that redistribution and growth could coexist: the *Bolsa Família* conditional cash transfer reached 14 million families, the real minimum wage increased by over 70%, and 40 million people exited poverty—all while maintaining fiscal responsibility (World Bank 2016).

The lessons for South Africa are instructive but cautionary. Brazil's commodity boom (2003-2011) provided fiscal space for redistribution that South Africa's slower growth has not. When the boom ended, Brazil's growth model faltered, and inequality began rising again after 2015. The deeper lesson is structural: neither country has overcome the colonial legacy of concentrated land ownership, racial inequality, and weak public education. Both demonstrate that social transfers can reduce poverty significantly but cannot substitute for the structural reforms—in education, competition, and land—needed to reduce *market* inequality (Lustig et al. 2013).

### C. Accelerated and Shared Growth Initiative for South Africa (ASGISA, 2006)

By the mid-2000s, the picture looked more favourable: commodity prices were high, growth averaged over 5 percent (2004-2007), and South Africa was preparing for the 2010 FIFA World Cup. Yet unemployment remained high and gains were uneven. ASGISA emerged in response (The Presidency 2006).

ASGISA identified six "binding constraints" on growth: deficiencies in government capacity and inefficiencies in state functions; the cost, efficiency, and capacity of the national logistics system; shortages of suitably skilled labour; barriers to entry, competition, and small business development; the regulatory environment; and deficiencies in infrastructure. For each constraint, initiatives were proposed (The Presidency 2006).

A key innovation was attention to the "second economy"—a term that would later be contested but captured the recognition that many South Africans were excluded from the formal economy and required targeted interventions. Expanded public works programmes, small enterprise support, and interventions in sectors like agriculture and construction aimed to draw people into economic activity.

ASGISA also initiated a more active approach to industrial policy, designating priority sectors for support. This laid the groundwork for the Industrial Policy Action Plans (IPAPs) that would follow under the dtic (Department of Trade, Industry and Competition 2007-2019). Sectors like automotive, clothing and textiles, and business process outsourcing received targeted attention.

The 2008 global financial crisis interrupted ASGISA. South Africa was less exposed than some economies, but growth slowed sharply, fiscal pressure rose, and policy focus shifted to crisis management (IMF 2009). ASGISA faded as an organising framework, though key elements persisted.

### D. The National Development Plan (NDP, 2012)

The National Development Plan, produced by the National Planning Commission and adopted by the Cabinet in 2012, represented the most comprehensive attempt to chart a long-term development trajectory (National Planning Commission 2012). It set targets for 2030: eliminating income poverty (then around 39 percent of the population below the food poverty line); reducing inequality (Gini coefficient from 0.69 to 0.60); and reducing unemployment (from around 25 percent narrow definition to 6 percent).

The NDP's diagnosis was broad. It identified nine key challenges: too few South Africans work; the quality of school education is poor; infrastructure is inadequate; spatial patterns exclude the poor; South Africa remains a divided society; the economy is unsustainably resource-intensive; a breakdown of public services affects the poor; corruption undermines state capacity; and South Africa is poorly positioned in the global economy (National Planning Commission 2012). For each challenge, chapters proposed interventions.

On employment, the NDP emphasised the need for faster GDP growth (5.4 percent annually) and more labour-intensive growth (one million new jobs from agriculture and agro-processing, 500,000 from household services, and substantial numbers from tourism, business services, and manufacturing). It called for a youth wage subsidy and more flexible arrangements for young and unemployed workers (Bhorat et al. 2014).

On education, it proposed binding constraints on the education system and fundamental reforms to school management, teacher quality, and curriculum implementation. On infrastructure, it called for massive investment in energy, water, transport, and telecommunications.

The NDP was adopted by consensus across political parties and remains the official long-term policy framework. Implementation, however, has been uneven (World Bank 2018). The plan lacked an implementation mechanism with teeth; unlike the RDP, it did not have a dedicated ministry or budget. Its targets are now statistically unreachable: with four years remaining until 2030, unemployment has increased rather than decreased, poverty reduction has stalled, and inequality remains near record levels (Statistics South Africa 2024). The goal of 6 percent unemployment by 2030 would require an economic transformation without historical precedent.

Adam Habib (2013) offered perhaps the sharpest critique: the NDP was strong on analysis and vision but weak on political economy. It identified what needed to happen but did not grapple with why previous efforts had failed or what would make this time different. The plan assumed a capable, aligned state that would implement its recommendations—an assumption contradicted by the very state capacity erosion it diagnosed. As Habib argued, the NDP treated implementation as a technical challenge when it was fundamentally a political one, requiring confrontation with the interests that benefited from the status quo.

### E. Operation Vulindlela and Structural Reforms (2020s)

The most recent phase of policy has focused on structural reform: removing growth constraints through regulatory change and reform of network industries and state-owned enterprises. Operation Vulindlela (OV), launched in 2020 by the Presidency and Treasury, coordinates these efforts (The Presidency 2020-2024).

OV's approach is more targeted than previous frameworks. Rather than comprehensive planning, it identifies specific reforms with high potential impact and drives implementation through a dedicated team with presidential authority (The Presidency 2020-2024). Priority areas have included:

* **Energy**: Raising the threshold for embedded generation (allowing businesses and households to generate their own power without licensing), which has triggered a boom in private renewable investment; reforming Eskom's structure; and accelerating independent power producer procurement.
* **Logistics**: Reforms to Transnet Freight Rail, including third-party access to rail infrastructure and private sector participation in port operations.
* **Digital**: Spectrum allocation (finally completed in 2022 after decades of delay); and reforms to reduce the cost of data and expand broadband access.
* **Water**: Reforms to water use licensing and bulk water infrastructure.
* **Visa reforms**: Streamlining visa processes to attract skills and tourists.

The results have been mixed but include some significant achievements (The Presidency 2020-2024). Private investment in renewable energy has surged following the embedded generation reforms, with over 6 GW of projects announced. Spectrum allocation has improved telecommunications infrastructure (ICASA 2023). But progress on Transnet has been slower, and the overall impact on growth is not yet clear. Critically, OV's reliance on presidential authority to bypass departmental inertia suggests a "workaround" rather than a systemic fix for the state capacity deficits it is designed to overcome. If political leadership changes or presidential attention shifts to other priorities, OV's reform momentum could dissipate—raising questions about whether structural reform driven by a small team at the centre can substitute for rebuilding implementation capacity across the state.

### F. The Government of National Unity and the Fiscal Turning Point (2024-2026)

The 2024 general election produced a watershed: for the first time since 1994, the ANC fell below 50 percent of the national vote, necessitating a coalition government. The resulting Government of National Unity (GNU)—encompassing the ANC, Democratic Alliance, Inkatha Freedom Party, and smaller parties—represented a new political configuration with uncertain but potentially significant economic implications.

The GNU's early record on economic policy has been shaped by coalition dynamics. The most dramatic test came over fiscal policy: the 2025 Budget's proposal to increase VAT from 15 to 17 percent over two years provoked the Democratic Alliance's temporary withdrawal from the coalition, exposing the tension between fiscal consolidation and political sustainability. The proposal was ultimately abandoned, and the 2026 Budget formally withdrew the planned R20 billion in tax increases, citing stronger-than-expected SARS collections (National Treasury 2026).

Whether the GNU represents a durable shift in South Africa's political economy or a transitional arrangement remains unclear. Optimists note that coalition discipline has, so far, supported fiscal consolidation: the primary surplus was restored in 2023/24, debt is projected to stabilise, and Standard & Poor's delivered the country's first sovereign credit upgrade in sixteen years in November 2025 (S\&P Global 2025). The end of load shedding in 2025—after over 200 consecutive days without cuts—removed one of the most visible economic constraints. South Africa's removal from the Financial Action Task Force (FATF) grey list demonstrated institutional capacity for reform when the political will exists—a proof point that compliance-driven reform, at least, can succeed. Pessimists observe that growth remains anemic at 1.6 percent, structural unemployment has not improved, and the coalition's survival depends on managing competing interests that may eventually prove incompatible. The GNU's significance for economic policy will become clearer as it faces harder choices—on the wage bill, land reform, SOE restructuring, and the future of the SRD grant—where coalition partners' interests diverge more sharply.

**Figure 1.3** shows the trajectory of government debt relative to GDP, illustrating the fiscal constraints within which these reforms must operate.

<figure><img src="/files/MsX1N6GxXRzxpvq4YQHI" alt="Line chart showing South Africa&#x27;s government debt-to-GDP ratio from 2005-2024. Debt was stable around 24% until 2008, then tripled to nearly 79% by 2025/26 due to fiscal deficits, state-owned enterprise bailouts, and COVID-19 spending, before projected stabilisation."><figcaption><p><strong>Figure 1.3:</strong> Government Debt-to-GDP Ratio. <em>Source: IMF, National Treasury. Note: Debt tripled from 24% of GDP in 2008 to nearly 79% by 2025/26, where the 2026 Budget projects it to peak before declining.</em></p></figcaption></figure>

#### Comparative Policy Box: Indonesia and Vietnam on Industrial Policy Discipline

Both Indonesia and Vietnam offer lessons on linking industrial policy to export performance and infrastructure. Indonesia's nickel policy—requiring processing of nickel ore before export—has drawn significant investment into smelting and battery-related industries. Vietnam's Special Economic Zones and industrial parks have attracted foreign direct investment by offering streamlined regulation, infrastructure, and time-bound incentives tied to export targets.

Key elements that might apply to South Africa:

* **Export discipline**: Making incentives conditional on export performance, rather than just production for protected domestic markets;
* **SEZ governance**: Creating ring-fenced zones with different regulatory environments to test and demonstrate reform possibilities;
* **Infrastructure linkage**: Tying industrial policy incentives to firms located where logistics and power are reliable (or making reliability improvements conditional on firm commitments);
* **Time limits**: Making incentives temporary and performance-based, rather than permanent entitlements.

South Africa's various industrial policy master plans and SEZ programmes have had mixed results. A more disciplined approach—with clearer performance criteria and consequences for non-delivery—might improve outcomes.

***

## V. The Policy-Making Ecosystem

Economic policy in South Africa emerges from the interaction of multiple institutions, each with distinct mandates, capabilities, and political relationships (Evans 1995). Understanding this ecosystem is essential for assessing why certain policies are adopted and others not, why implementation often falls short of design, and where the opportunities for reform might lie.

### A. Core Economic Policy Institutions

**The Presidency** has become increasingly central to economic policy coordination, particularly since the establishment of Operation Vulindlela. The President chairs the Cabinet and has authority over the organisation of government. Under Presidents Thabo Mbeki and Cyril Ramaphosa, in particular, the Presidency has taken a more active role in economic policy, partly to overcome coordination failures across departments. The Presidential Infrastructure Coordinating Commission (PICC), the Investment and Infrastructure Office, and now OV are examples of Presidency-based coordination mechanisms.

**The National Treasury** is the most powerful economic policy institution in the executive branch (National Treasury 2024). It controls the budget process, allocates resources across departments, monitors expenditure, and manages government debt. Its officials are generally regarded as among the most technically capable in government. Treasury's institutional culture emphasises fiscal discipline, value for money, and skepticism toward spending proposals that lack rigorous justification. This has made Treasury a force for macroeconomic stability but also, in the view of critics, a constraint on developmental spending (Marais 2011).

Treasury's power derives from several sources: control over the budget; representation on the boards of major state-owned enterprises; responsibility for economic policy coordination in the cabinet system; and relationships with international financial institutions and credit rating agencies. When Treasury is aligned with presidential priorities, policy coherence is higher; when there is tension, gridlock can result.

**The South African Reserve Bank (SARB)** operates with constitutionally protected independence to maintain price stability (South African Reserve Bank 2024). Its Monetary Policy Committee sets interest rates based on an inflation-targeting framework (targeting CPI inflation of 3-6 percent). The SARB has been generally successful in keeping inflation within target, though critics argue that its focus on price stability has sometimes come at the cost of growth and employment (Gillian Hart 2013; Padayachee and Gillian Hart 2016). The Bank also supervises the financial system and manages foreign exchange reserves.

The SARB's independence is periodically contested. Calls for nationalisation (it remains one of the few central banks with private shareholders, though this has no bearing on policy) and for changing the mandate to include employment objectives have been made by various ANC and Alliance groupings. To date, the Bank's independence has been maintained, and its credibility in financial markets has been an asset during periods of fiscal stress (South African Reserve Bank 2024; see Chapter 2 for the inflation-targeting framework).

**The Department of Trade, Industry and Competition (dtic)** is responsible for industrial policy, trade negotiations, competition policy, and investment promotion (Department of Trade, Industry and Competition 2007-2019). It has championed sectoral "master plans"—negotiated agreements among government, business, and labour to develop specific sectors—covering autos, steel, clothing and textiles, poultry, and other industries (Department of Trade, Industry and Competition 2020, 2021). The dtic's orientation is generally more interventionist than Treasury's, favouring active industrial policy to promote domestic manufacturing and employment.

Tensions between Treasury and the dtic over trade policy, industrial subsidies, and local content requirements have been a recurring feature of post-apartheid policymaking (Kaplan 2004; see Chapter 6 for evaluation of sectoral Master Plans). These reflect genuine analytical disagreements—about the effectiveness of industrial policy, the costs of protection, the reliability of government intervention—as well as institutional competition.

### B. Consultative Bodies and Social Dialogue

**The National Economic Development and Labour Council (NEDLAC)** is a statutory body that brings together government, organised business, organised labour, and community constituencies to discuss economic and labour policy. Legislation affecting labour markets is supposed to go through NEDLAC before being introduced in Parliament (Habib 2013).

NEDLAC represented an attempt to institutionalise social dialogue and consensus-building—a "corporatist" approach modeled partly on European examples. In practice, its effectiveness has been limited. Consensus is often elusive; delays in reaching agreement slow policy processes; and the "community constituency" is weakly organised compared to business and labour. Nevertheless, NEDLAC remains an important forum for signaling and negotiation, even when it does not produce binding agreements (Seekings and Nattrass 2005).

### C. External Influences

South Africa's economic policy is influenced by external actors and constraints, though less so than in some other emerging markets (IMF 2024). The country is not under an IMF programme and has maintained market access for government borrowing (albeit at rising costs). But credit rating agencies, foreign investors, and international institutions still shape the policy environment.

**Credit rating agencies** (Moody's, S\&P, Fitch) assess South Africa's creditworthiness, and their ratings affect borrowing costs. South Africa lost investment-grade status from all major agencies between 2017 and 2020, pushing up the cost of government borrowing and excluding the country from some bond indices (National Treasury 2021). The prospect of rating downgrades has been cited as a reason for fiscal restraint.

**The IMF and World Bank** provide technical advice, publish assessments (the annual Article IV consultation reports), and could potentially provide financing in a crisis (IMF 2024; World Bank 2018). South Africa has not required IMF lending since democracy, but the possibility of needing to do so in a severe crisis has been raised during periods of fiscal stress.

**Regional and global trade agreements** shape trade policy options. South Africa is a member of the Southern African Customs Union (SACU), which constrains tariff policy; of the WTO, which limits certain forms of industrial policy (WTO 2024); and of the African Continental Free Trade Area (AfCFTA), which is gradually reducing intra-African trade barriers.

***

## VI. Key Economic Outcomes and Political Economy Challenges

The policy frameworks and institutional arrangements described above have produced a set of outcomes that define contemporary South Africa's economic challenges (OECD 2024; World Bank 2018). We highlight four dimensions: growth performance, persistent inequality and poverty, the unemployment crisis, and the problem of corruption and state capture.

### A. Growth Performance: From Promise to Stagnation

South Africa's post-apartheid growth trajectory can be divided into three periods (Du Plessis and Smit 2007; South African Reserve Bank 2024). The transition period (1994–2002) saw modest and volatile growth, averaging around 2.5 percent annually, as the economy adjusted to liberalisation, new institutions bedded down, and global conditions fluctuated. The commodity boom period (2003–2008) delivered the strongest growth in decades—averaging over 5 percent—as rising commodity prices boosted mining revenues, credit expansion fueled consumption, and optimism about South Africa's prospects attracted investment. The stagnation period (2009–present) has seen growth slow to near-zero, with brief recoveries interrupted by fresh shocks.

The proximate causes of stagnation are multiple: the 2008 global financial crisis and subsequent weak global growth; the electricity crisis that has worsened since 2007; the decline of Transnet's rail and port capacity; policy uncertainty in areas like mining regulation and land reform; and the erosion of state capability through corruption and mismanagement (Eskom 2024; Transnet 2024).

But these proximate causes reflect deeper structural issues. As Loewald (2024) argues, microeconomic policy failures—not just macroeconomic settings—are the binding constraints on growth: per capita income fell 0.4 percent per year between 2013 and 2019, while unemployment rose from 22.5 to 32.1 percent. Loewald, Faulkner, and Makrelov (2020) show that sustained fiscal deficits, high debt, and relatively high inflation have impeded the price and factor adjustments needed for higher productivity—demonstrating that time-inconsistent macroeconomic policy, not only structural reform, is critical for growth. Total factor productivity growth—the efficiency with which the economy combines capital and labour—has been negative or near-zero for over a decade (World Bank 2018). Investment rates have fallen below depreciation rates in some years, meaning the capital stock is not being maintained (South African Reserve Bank 2024). Skills mismatches mean that unemployment coexists with vacancy rates in some occupations (Banerjee et al. 2008). And the structure of the economy—dominated by capital-intensive mining and finance—is not oriented toward absorbing labour (Fine and Rustomjee 1996; Nattrass 2001).

**Figure 1.4** compares South Africa's growth performance with peer emerging markets, illustrating the divergence that has widened since the 2008 crisis.

<figure><img src="/files/yhpyaQpYyETMFzICWmTy" alt="Multi-panel comparison chart showing GDP growth rates for South Africa versus emerging market peers (Indonesia, India, Brazil, Turkey, Mexico) from 2010-2024. South Africa&#x27;s 1.3% average growth significantly underperforms Indonesia (4.7%) and India (6.2%)."><figcaption><p><strong>Figure 1.4:</strong> Emerging Market Growth Comparison. <em>Source: World Bank.</em></p></figcaption></figure>

### B. Persistent Inequality and Poverty

South Africa's Gini coefficient—at 0.63 on some measures, slightly lower on others—is the highest or among the highest in the world (Statistics South Africa 2019; World Inequality Database). Inequality has not declined meaningfully since 1994; some measures suggest it has increased (Leibbrandt et al. 2010). The composition of inequality has shifted: inter-racial inequality has declined (a growing black middle class has reduced the gap between racial group averages) while intra-racial inequality has increased (the gap between the black middle class and the black poor has widened).

> **0.63** — South Africa's Gini coefficient, making it the most unequal society on earth by conventional income measures.

Poverty, by contrast, has declined—but from very high levels and not as rapidly as in many other countries (Statistics South Africa 2017). The share of the population below the food poverty line fell from about 28 percent in the early 2000s to around 18 percent by the early 2020s. The share below the upper-bound poverty line (a more generous threshold) has declined less, remaining above 50 percent. South Africa's poverty reduction has been driven more by social grants—a point explored in Chapter 10—than by employment growth (Bhorat and Cassim 2014).

The persistence of inequality reflects the durability of apartheid-era asset and human capital distributions (Seekings and Nattrass 2005; Terreblanche 2002). Wealth inequality is even more extreme than income inequality; those who owned land, housing, financial assets, and businesses in 1994 and their descendants have benefited from appreciation and accumulation, while those who started with nothing have found it difficult to accumulate. Human capital advantages—better schools, university education, professional networks—are transmitted across generations. Breaking these patterns requires sustained interventions that the post-apartheid state has only partially achieved.

### C. The Unemployment Crisis

South Africa's unemployment rate—over 32 percent by the official definition, and over 40 percent if discouraged workers are included—is the defining economic pathology of the contemporary period (Statistics South Africa 2024). No other upper-middle-income country has unemployment at this level outside of wartime conditions (ILO 2024).

Recent research reframes the challenge in stark terms: Essa et al. (2025) describe a "crisis of missing jobs"—fewer than 3 million jobs were created since 2015 while 4 million new jobseekers entered the market. At the current pace of job creation, it would take over 200 years to employ today's 12.6 million unemployed. The political economy of unemployment involves several interacting factors (Banerjee et al. 2008; Kingdon and Knight 2004):

* **Structural**: The economy inherited from apartheid was designed to use minimum labour; its capital-intensive industries do not readily absorb workers (Fine and Rustomjee 1996).
* **Skills mismatch**: Education failures leave many workers without the skills that employers demand; at the same time, high skills command premia that make formal employment expensive (Spaull 2013).
* **Labour market institutions**: Minimum wages, employment protection, and bargaining council agreements may price some workers out of formal employment—though this is contested, with some arguing that wage levels are not binding constraints (Magruder 2013; Rankin 2020).
* **Spatial**: Many potential workers live far from where jobs are located, and transport costs make low-wage employment unviable (Banerjee et al. 2008).
* **Small firm constraints**: Regulations, crime, and other barriers make it difficult to start and grow small businesses that might otherwise absorb labour.
* **Missing informal sector**: Unlike in other developing countries, South Africa's informal sector is small and does not provide a fallback for those excluded from formal employment (ILO 2018).

The unemployment crisis is not merely an economic problem but a social and political one. Unemployment is concentrated among the young (over 60 percent of those aged 15-24 are unemployed) and among black South Africans (Statistics South Africa 2024). It is associated with crime, social instability, and political alienation. Addressing it is the central challenge of economic policy (National Planning Commission 2012).

### D. Corruption and State Capture

The period from roughly 2009 to 2018—corresponding to the presidency of Jacob Zuma—saw widespread corruption and what has been termed "state capture": the systematic reorientation of state institutions and resources to benefit politically connected individuals and networks, particularly the Gupta family and their associates (Chipkin and Swilling 2018).

State capture affected virtually every major state-owned enterprise: Eskom (where irregular and corrupt coal contracts were signed), Transnet (locomotives procurement), SAA (route planning), and others (Zondo Commission 2022). It extended to the security services (used to protect corrupt networks), the prosecuting authority (institutionally weakened to prevent accountability), and the Treasury itself (where a minister who resisted was removed).

The economic costs were substantial. Investment in state infrastructure was diverted or stolen. The maintenance of existing infrastructure was neglected as resources were looted. Capable managers were replaced with compliant ones; institutional memory was lost; and organisational cultures were corroded (Chipkin and Swilling 2018). The electricity crisis that reached its peak in 2023—with load shedding at Stage 6 (shedding up to 6,000 MW)—is in significant part a consequence of state capture at Eskom (Eskom 2024).

The Zondo Commission, established in 2018, documented state capture in extensive detail across multiple reports (Zondo Commission 2022). Criminal prosecutions are underway, though progress has been slow. The current administration has emphasised anti-corruption and rebuilding state capability, but institutional repair is a long-term project.

**Figure 1.5** presents a timeline of key policy events and shocks, providing visual context for the political economy developments discussed throughout this chapter.

<figure><img src="/files/O419MDxT6jraco81L5qq" alt="Timeline chart mapping key economic policy events and shocks in South Africa from 1994-2024, including RDP launch (1994), GEAR adoption (1996), commodity boom (2003-2008), global financial crisis (2008), state capture era (2009-2018), and Operation Vulindlela reforms (2020-present)."><figcaption><p><strong>Figure 1.5:</strong> Policy Timeline (1994-2024). <em>Source: Various government and academic sources.</em></p></figcaption></figure>

***

## VII. Conclusion: The Road Ahead

This chapter has traced the political economy of South Africa from the legacies of apartheid through the transition to democracy and the evolution of policy frameworks over three decades. The picture that emerges is of an economy constrained by inherited distortions, shaped by contested policy choices, and challenged by persistent failures of growth, employment, and inclusion (Marais 2011; Habib 2013).

Several themes recur across this history. First, the durability of structural legacies: apartheid created spatial, asset, and human capital configurations that have proven resistant to change, even with democratic government and substantial redistributive effort (Terreblanche 2002; Seekings and Nattrass 2005). Second, the difficulty of balancing stabilisation and transformation: every government has faced the tension between maintaining macroeconomic credibility and pursuing developmental objectives, and none has fully resolved it (Hirsch 2005; Bond 2000). Third, the importance of state capability: policy intentions are only as good as the institutions that implement them, and the erosion of capability through corruption and mismanagement has repeatedly undermined well-designed plans (Chipkin and Swilling 2018).

Yet the story is not one of unremitting failure. The post-apartheid state has delivered basic services to millions, expanded social protection to become one of the world's larger grant systems relative to GDP, and maintained democratic institutions through periods of severe stress (Bhorat and Cassim 2014). The economy, for all its problems, remains the continent's most sophisticated. And there are bright spots: the renewable energy sector is booming; some manufacturing subsectors remain competitive; the financial sector is world-class; and the recent structural reform efforts show that change is possible (The Presidency 2020-2024).

Looking ahead, the central challenge is clear: South Africa must find a path to growth that creates employment at scale (National Planning Commission 2012). This requires action on multiple fronts—the network industries (energy, logistics, telecommunications) that constrain all other economic activity; education and skills systems that produce capable workers; regulatory environments that enable rather than obstruct enterprise; and labour market arrangements that balance protection with job creation.

The political economy of such reforms is daunting (Acemoglu and Robinson 2012). Vested interests benefit from the status quo. Coordination failures impede collective action. Short-term political pressures work against long-term investments. The state capacity required to implement reforms effectively is itself in need of repair (Evans 1995).

But the alternative—continued stagnation, rising unemployment, and the social instability that follows—is untenable. South Africa's democratic settlement rests ultimately on its ability to deliver economic inclusion. Three decades after the transition, that delivery remains incomplete. The chapters that follow examine the specific dimensions of this challenge—macroeconomic frameworks, infrastructure, agriculture, mining, manufacturing, services, labour markets, human capital, and social protection—seeking to understand the constraints and identify the possibilities for change.

### Binding Constraints Connection

This chapter establishes the political economy context through which all six binding constraints identified in the introduction emerged. The **energy crisis** and **logistics breakdown** are products of the institutional decay and state capture documented here—failures of governance at Eskom and Transnet that Chapter 3 examines in detail. **State capacity erosion** reflects the tension between transformation imperatives and institutional maintenance that defined the post-1994 period. **Human capital deficits** trace to the apartheid education system's deliberate destruction of black human potential, compounded by post-1994 policy failures (Chapter 9). **Labour market dysfunction** has roots in the insider-outsider dynamics of the transition bargain (Chapter 8). And the **investment collapse** reflects the cumulative effect of policy uncertainty, infrastructure failures, and declining confidence that the political economy of the post-Zuma era has only partially begun to address. Understanding these political economy origins is essential for designing reforms that are not merely technically sound but politically feasible.

{% hint style="success" %}
**Key Takeaways**

1. South Africa's economic challenges are deeply rooted in apartheid-era policies that created enduring spatial, asset, and human capital distortions—particularly through land dispossession, inferior education systems, and the migrant labour system.
2. The negotiated transition (1990-1994) preserved economic continuity, inheriting structural constraints while the new government faced expectations for rapid transformation within tight fiscal and political boundaries.
3. Economic policy frameworks evolved from RDP (basic needs) through GEAR (macroeconomic stability) to NDP (comprehensive planning) and Operation Vulindlela (targeted structural reforms), each with partial successes but failing to resolve the core growth-employment challenge. The 2024 Government of National Unity introduced coalition dynamics to economic policymaking, with early results including the end of load shedding and the first sovereign credit upgrade in sixteen years.
4. Three decades post-apartheid, South Africa faces a "triple challenge" of stagnant growth (averaging 1% annually), extreme inequality (Gini of 0.63), and mass unemployment (over 32%), making it one of the most troubling development puzzles globally.
5. State capture (2009-2018) compounded structural challenges by hollowing out institutional capacity, particularly in state-owned enterprises like Eskom, while corruption and mismanagement diverted resources from developmental priorities.
   {% endhint %}

## Discussion Questions

1. To what extent are South Africa's contemporary economic challenges attributable to apartheid legacies versus post-apartheid policy choices? How might you design research to distinguish between these factors?
2. The transition from RDP to GEAR is sometimes described as a shift from "transformation" to "stabilisation." Do you agree with this characterisation? What are its limitations?
3. Comparing South Africa's unemployment rate with other middle-income countries (Brazil, Turkey, Mexico), what hypotheses would you propose to explain the difference?
4. The National Development Plan set ambitious targets for 2030 that have not been met. Was the plan's design flawed, its implementation inadequate, or were its targets simply unrealistic? What would need to change for future planning exercises to be more effective?
5. Operation Vulindlela represents a different approach to reform—targeted rather than comprehensive, coordination-focused rather than planning-focused. What are the advantages and disadvantages of this approach?

**Exercises**

1. **GDP growth decomposition**: South Africa's real GDP grew at an average of approximately 5% per year during 2004-2007, then slowed to approximately 1% per year during 2014-2023. Using data from Figure 1.1, decompose the growth slowdown into contributions from (a) population growth, (b) labour force participation changes, (c) employment growth, and (d) labour productivity growth. Which factor explains the largest share of the deceleration?
2. **EME comparison**: Using Figure 1.4 and World Bank data, calculate the cumulative GDP growth for South Africa, Indonesia, India, and Turkey from 2010 to 2023. If South Africa had grown at Indonesia's average rate (approximately 4.7% per year) instead of its own (approximately 1.3%), how much larger would GDP be in 2023? Express this difference both in rand terms (using a 2023 GDP of approximately R7.2 trillion) and as a share of actual GDP.
3. **Investment gap analysis**: Figure 1.2 shows gross fixed capital formation declining from 21.6% of GDP (2008) to approximately 15% (2023). Using a GDP of R7.2 trillion, calculate the annual investment shortfall (in rand) relative to the 2008 peak ratio. If the incremental capital-output ratio (ICOR) is approximately 5, estimate how much additional GDP growth this "missing investment" would have generated annually.
4. **Policy timeline mapping**: Using Figure 1.5 and the chapter's discussion of policy frameworks (RDP, GEAR, ASGISA, NDP, Operation Vulindlela), construct a table listing each framework's (a) primary growth target, (b) actual growth achieved during its period, (c) primary employment target, and (d) actual employment outcome. What patterns emerge? How do you explain the persistent gap between targets and outcomes?

***

## VIII. Key Data Visualisations

This chapter incorporates five data visualisations:

1. **Figure 1.1:** Real GDP and growth rate (1993-2024) — Illustrates growth deceleration from 5% during the commodity boom to under 1% in recent years.
2. **Figure 1.2:** Gross Fixed Capital Formation (% of GDP, 2000-2023) — Shows investment collapse from 21.6% peak (2008) to 13.7% (2020), with limited recovery.
3. **Figure 1.3:** Government Debt-to-GDP (2005-2024) — Documents fiscal trajectory: debt tripled from 24% (2008) to 76% (2024), projected to peak at nearly 79% in 2025/26 (see Chapter 2 for detailed fiscal analysis).
4. **Figure 1.4:** Comparative EME Growth Rates (SA vs. peers) — Compares SA's 1.3% average with Indonesia (4.7%), India (6.2%), and other emerging markets.
5. **Figure 1.5:** Policy Timeline (1994-2024) — Maps major economic events and policy shifts across the democratic era.

***

## IX. Further Reading

**Essential Texts:**

* Gillian Hart, *Rethinking the South African Crisis* (2013) — Critical political economy perspective on post-apartheid development.
* Nicoli Nattrass and Jeremy Seekings, *Class, Race and Inequality in South Africa* (2005) — Analysis of distributional dynamics before and after apartheid.
* Oqubay, Tregenna, and Valodia (eds.), *The Oxford Handbook of the South African Economy* (2021) — Comprehensive reference covering all major economic topics.

**On Economic Policy:**

* Christopher Loewald, "Why South Africa's Economic Growth is Stalled," ERSA Economic Note (2024) — Diagnosis of growth constraints emphasising microeconomic policy failures.
* Christopher Loewald, David Faulkner, and Konstantin Makrelov, "Time Consistency and Economic Growth," ERSA Working Paper 842 (2020) — How sustained fiscal deficits and high inflation impede growth.
* Christopher Loewald et al., "Macroeconomic Policy" in *Oxford Handbook* (2021) — Technical analysis of macro frameworks.
* Pamela Mondliwa and Simon Roberts, "The Politics of Economic Change," Econ3x3 (2022) — How corporate restructuring and power entrenchment undermined industrial policy.
* Operation Vulindlela Progress Reports (available from Presidency website) — Official documentation of structural reform progress.

**On Growth Diagnostics:**

* Ricardo Hausmann et al., "Growth Through Inclusion in South Africa," CID Working Paper 434 (2023) — Harvard Growth Lab's two-year diagnostic identifying state capacity collapse and spatial exclusion as binding constraints. Strongest on urban density/zoning analysis and former homeland employment gaps; weaker on political economy of reform. Facilitated by CDE; some critics (e.g., Muller 2023) argue the findings echo existing South African research. See Chapters 3 and 8 for integration of key findings.

**On State Capture:**

* Ivor Chipkin and Mark Swilling, *Shadow State* (2018) — Analysis of state capture networks and mechanisms.
* Zondo Commission Reports (2022) — Comprehensive documentation of state capture.

**On the Minerals-Energy Complex and Growth:**

* J. Paul Dunne (2013) and Dunne and Uye (2010) — Econometric evidence linking manufacturing decline to South Africa's growth slowdown, and analysis of how military spending crowded out productive investment during and after apartheid.

**Historical Background:**

* William Beinart and Saul Dubow (eds.), *Segregation and Apartheid in Twentieth-Century South Africa* (1995) — Collection on apartheid's economic dimensions.
* Johan Fourie, *Our Long Walk to Economic Freedom: Lessons from 100,000 Years of Human History* (Cambridge University Press, 2022) — Accessible economic history from an African perspective across 35 chapters, from early human migration to COVID-19.
* Sampie Terreblanche, *A History of Inequality in South Africa* (2002) — Long-run perspective on inequality and development.

***

◀️ [Introduction](/textbooks/the-south-african-economy/introduction.md)[Chapter 2: The Macroeconomic Framework](/textbooks/the-south-african-economy/part-i-foundations/chapter-2.md) ▶️


---

# Agent Instructions: Querying This Documentation

If you need additional information that is not directly available in this page, you can query the documentation dynamically by asking a question.

Perform an HTTP GET request on the current page URL with the `ask` query parameter:

```
GET https://laurence-wilse-samson.gitbook.io/textbooks/the-south-african-economy/part-i-foundations/chapter-1.md?ask=<question>
```

The question should be specific, self-contained, and written in natural language.
The response will contain a direct answer to the question and relevant excerpts and sources from the documentation.

Use this mechanism when the answer is not explicitly present in the current page, you need clarification or additional context, or you want to retrieve related documentation sections.
