> For the complete documentation index, see [llms.txt](https://laurence-wilse-samson.gitbook.io/textbooks/llms.txt). Markdown versions of documentation pages are available by appending `.md` to page URLs; this page is available as [Markdown](https://laurence-wilse-samson.gitbook.io/textbooks/the-south-african-economy/part-ii-sectors/chapter-3.md).

# Chapter 3: State Capability, Institutions, and Infrastructure

## Learning Objectives

By the end of this chapter, you should be able to:

1. **Explain** the historical evolution of South Africa's state-owned enterprises and their governance arrangements
2. **Analyse** the causes and consequences of the electricity crisis, including the role of underinvestment, mismanagement, and corruption
3. **Assess** the logistics crisis in rail and ports, including its impact on export competitiveness
4. **Evaluate** the relationship between state capture and institutional decay, including municipal collapse and water infrastructure risks
5. **Compare** South Africa's infrastructure challenges with those of peer countries and identify lessons for reform

***

## I. Introduction: The "Capable State" Dilemma

The democratic transition of 1994 was accompanied by an ambitious vision: a South African "developmental state" capable of leading transformation, correcting apartheid-era market failures and injustice, and extending services to previously excluded populations (Marais 2011; Habib 2013). The model drew inspiration from East Asian cases—South Korea, Taiwan, and Singapore—where capable bureaucracies and coordinated public investment supported rapid industrialisation (Evans 1995; Amsden 1989; Wade 1990).

Three decades later, the gap between that vision and reality remains stark, even as recent reforms have begun to narrow it (Chipkin and Swilling 2018). For years, SOEs meant to provide infrastructure became crisis points—most visibly Eskom, whose unreliability imposed large economy-wide costs (Eskom 2024; CSIR 2024). The end of load shedding in 2025 and Eskom's return to profitability demonstrate that institutional recovery is possible, but Transnet's logistics breakdown persists, bureaucratic capability remains hollowed out by skills loss, patronage, and corruption during state capture (Zondo Commission 2022), and many municipalities have collapsed in core service functions, from water and roads to refuse collection (Auditor-General South Africa 2023).

This deterioration matters directly for economic outcomes. Infrastructure is not background; it is a binding constraint. When electricity failed, production stopped—at an estimated cost of 2-5 percent of GDP annually during the worst years. When rail fails, exporters shift to costlier road logistics. When water systems fail, both welfare and economic activity are threatened. The infrastructure crisis remains the most visible and costly expression of state-capability failure, even as the electricity dimension has eased.

This chapter focuses on energy and transport—the network industries where infrastructure failure has been most economically damaging. Digital infrastructure, including the 2022 spectrum auction and Operation Vulindlela's Rapid Deployment Policy for broadband rollout, represents an important complementary reform frontier; its development is examined in Chapter 7's treatment of the digital economy and telecommunications sector.

This chapter examines the institutions shaping infrastructure provision, focusing on SOEs in network industries and their regulatory frameworks. It reviews SOE governance, then analyses the two core crises—electricity (Eskom) and logistics (Transnet)—before examining broader institutional decay, including state capture and municipal collapse. Comparative cases are used to draw reform lessons.

Our central argument is that state capability has become South Africa's binding constraint. Macroeconomic stability (Chapter 2) cannot deliver growth if production infrastructure is unreliable. Sectoral policies (Chapters 4-7) cannot succeed when implementation institutions are dysfunctional. The unemployment crisis (Chapter 8) cannot ease if firms cannot operate reliably. Rebuilding state capability—especially in network industries—is therefore a precondition for progress across the broader agenda.

### A Framework for Understanding State Capacity

"State capacity" is invoked frequently in South African debate but rarely defined with analytical precision. Following Centeno, Kohli, and Yashar (2017), this book distinguishes four dimensions that are analytically distinct, require different reform strategies, and have followed different trajectories in the democratic era.

**Technical and operational capacity** refers to the skills, systems, and processes that enable institutions to perform their core functions—collecting revenue, maintaining power stations, delivering clean water, teaching children to read. This is the domain of engineers, accountants, data analysts, and professional managers. South Africa built world-class technical capacity in several institutions after 1994. The South African Revenue Service (SARS) under Commissioner Pravin Gordhan (1999–2009) became one of the most effective tax administrations in the developing world, raising the revenue-to-GDP ratio from 24 percent to over 28 percent through systematic modernisation of compliance systems (Chapter 7). Eskom's operations division maintained plant availability above 90 percent through the early 2000s. These achievements demonstrate that technical capacity is achievable—and, critically, that it can be destroyed far more quickly than it is built.

**Institutional norms** encompass the formal rules and informal conventions that govern how organisations function: meritocratic hiring, performance accountability, anti-corruption safeguards, and professional independence from political interference. The Zondo Commission (2022) documented in devastating detail how the erosion of institutional norms enabled state capture. At Eskom, technically qualified board members were replaced with politically connected individuals who approved procurement contracts designed to extract rents rather than deliver services. At Transnet, locomotive procurement contracts were inflated by billions of rands to fund kickbacks. At SARS, the investigative capacity that had been painstakingly built over a decade was systematically dismantled under Commissioner Tom Moyane (2014–2018), with experienced staff driven out and the Large Business Centre—responsible for the most complex and highest-value compliance work—effectively gutted (Nugent Commission 2018; Chapter 7).

The mechanism of this erosion deserves explicit analysis. **Cadre deployment**—the ANC's practice of placing party loyalists in professional positions across the state, SOEs, and regulatory bodies—was originally conceived as a transformation tool: replacing apartheid-era incumbents with politically aligned personnel who would advance democratic objectives (Chipkin and Swilling 2018). The policy had legitimate roots. The apartheid bureaucracy had actively obstructed change; political principals needed officials they could trust to implement new mandates. But cadre deployment evolved from a transitional tool into a permanent system of patronage appointment that subordinated technical competence to political loyalty. The distinction between placing a capable, politically aligned professional in a strategic position and installing an unqualified loyalist to control procurement is the distinction between transformation and capture—and in practice, the boundary was eroded progressively from the mid-2000s onward (Cloete 2022).

**Coordination capacity** refers to the ability of government to align multiple institutions towards shared objectives. South Africa's intergovernmental system—national, provincial, and municipal—creates coordination challenges by design. The Division of Revenue Act allocates resources across tiers, but mandates, responsibilities, and capabilities are often misaligned. Operation Vulindlela, launched in 2020 as a joint initiative of the Presidency and National Treasury, represents the most systematic attempt to address coordination failures. Its approach—identifying specific regulatory or administrative blockages, then convening the relevant stakeholders to resolve them—has delivered measurable results in spectrum allocation, electricity market reform, and visa processing (National Treasury and The Presidency 2025). The model's success suggests that coordination failures are often more tractable than they appear, provided there is senior political sponsorship and technical capacity to identify binding regulatory bottlenecks.

**Implementation capacity** is the ability to translate policy intent into service delivery at the point of contact between the state and citizens. This is where South Africa's capacity deficit is most acutely felt. Of the country's 257 municipalities, 163 were in financial distress (National Treasury 2026). Qualified or adverse audit opinions have become the norm rather than the exception at the local level. The consequences are concrete: water treatment plants that fail, roads that deteriorate, refuse that goes uncollected, and building plans that take months to process. For households in former homeland areas—the Eastern Cape, Limpopo, and parts of KwaZulu-Natal—municipal failure means that the democratic state has not yet delivered the basic services that apartheid denied (Chapter 10).

The table below summarises these dimensions with South African examples:

| Dimension             | Success case                           | Failure case                        | Current trajectory                                      |
| --------------------- | -------------------------------------- | ----------------------------------- | ------------------------------------------------------- |
| Technical/operational | SARS (1999–2009)                       | Eskom maintenance backlog           | Mixed: SARS recovering; Transnet still declining        |
| Institutional norms   | SARB independence                      | SOE board capture (2009–2018)       | Improving: Zondo reforms, prosecutorial capacity        |
| Coordination          | Operation Vulindlela                   | Provincial health/education silos   | Cautiously positive: model proven but scaling uncertain |
| Implementation        | Electrification programme (1994–2010s) | Municipal water/sanitation collapse | Deteriorating: 163 of 257 municipalities in distress    |

These dimensions interact. Technical capacity is unsustainable without institutional norms that protect it from political interference—as the SARS case demonstrates. Coordination capacity depends on implementation capacity at each node in the system. And all four dimensions require sustained political commitment to meritocracy over patronage, which returns the analysis to the political economy questions examined in Chapter 1 and the Conclusion.

The evidence from South Africa's own experience suggests that capacity can be rebuilt—but only under specific conditions: professional leadership insulated from political interference, sustained fiscal support, institutional memory preserved through staff retention, and external accountability mechanisms (courts, auditors, civil society) that constrain backsliding. Chapter 7's SARS recovery case, Eskom's post-2023 turnaround, and Operation Vulindlela each illustrate aspects of this formula. Whether these individual successes can be generalised across the state—and particularly to the municipal level, where the capacity deficit is deepest—remains the central question of South African governance.

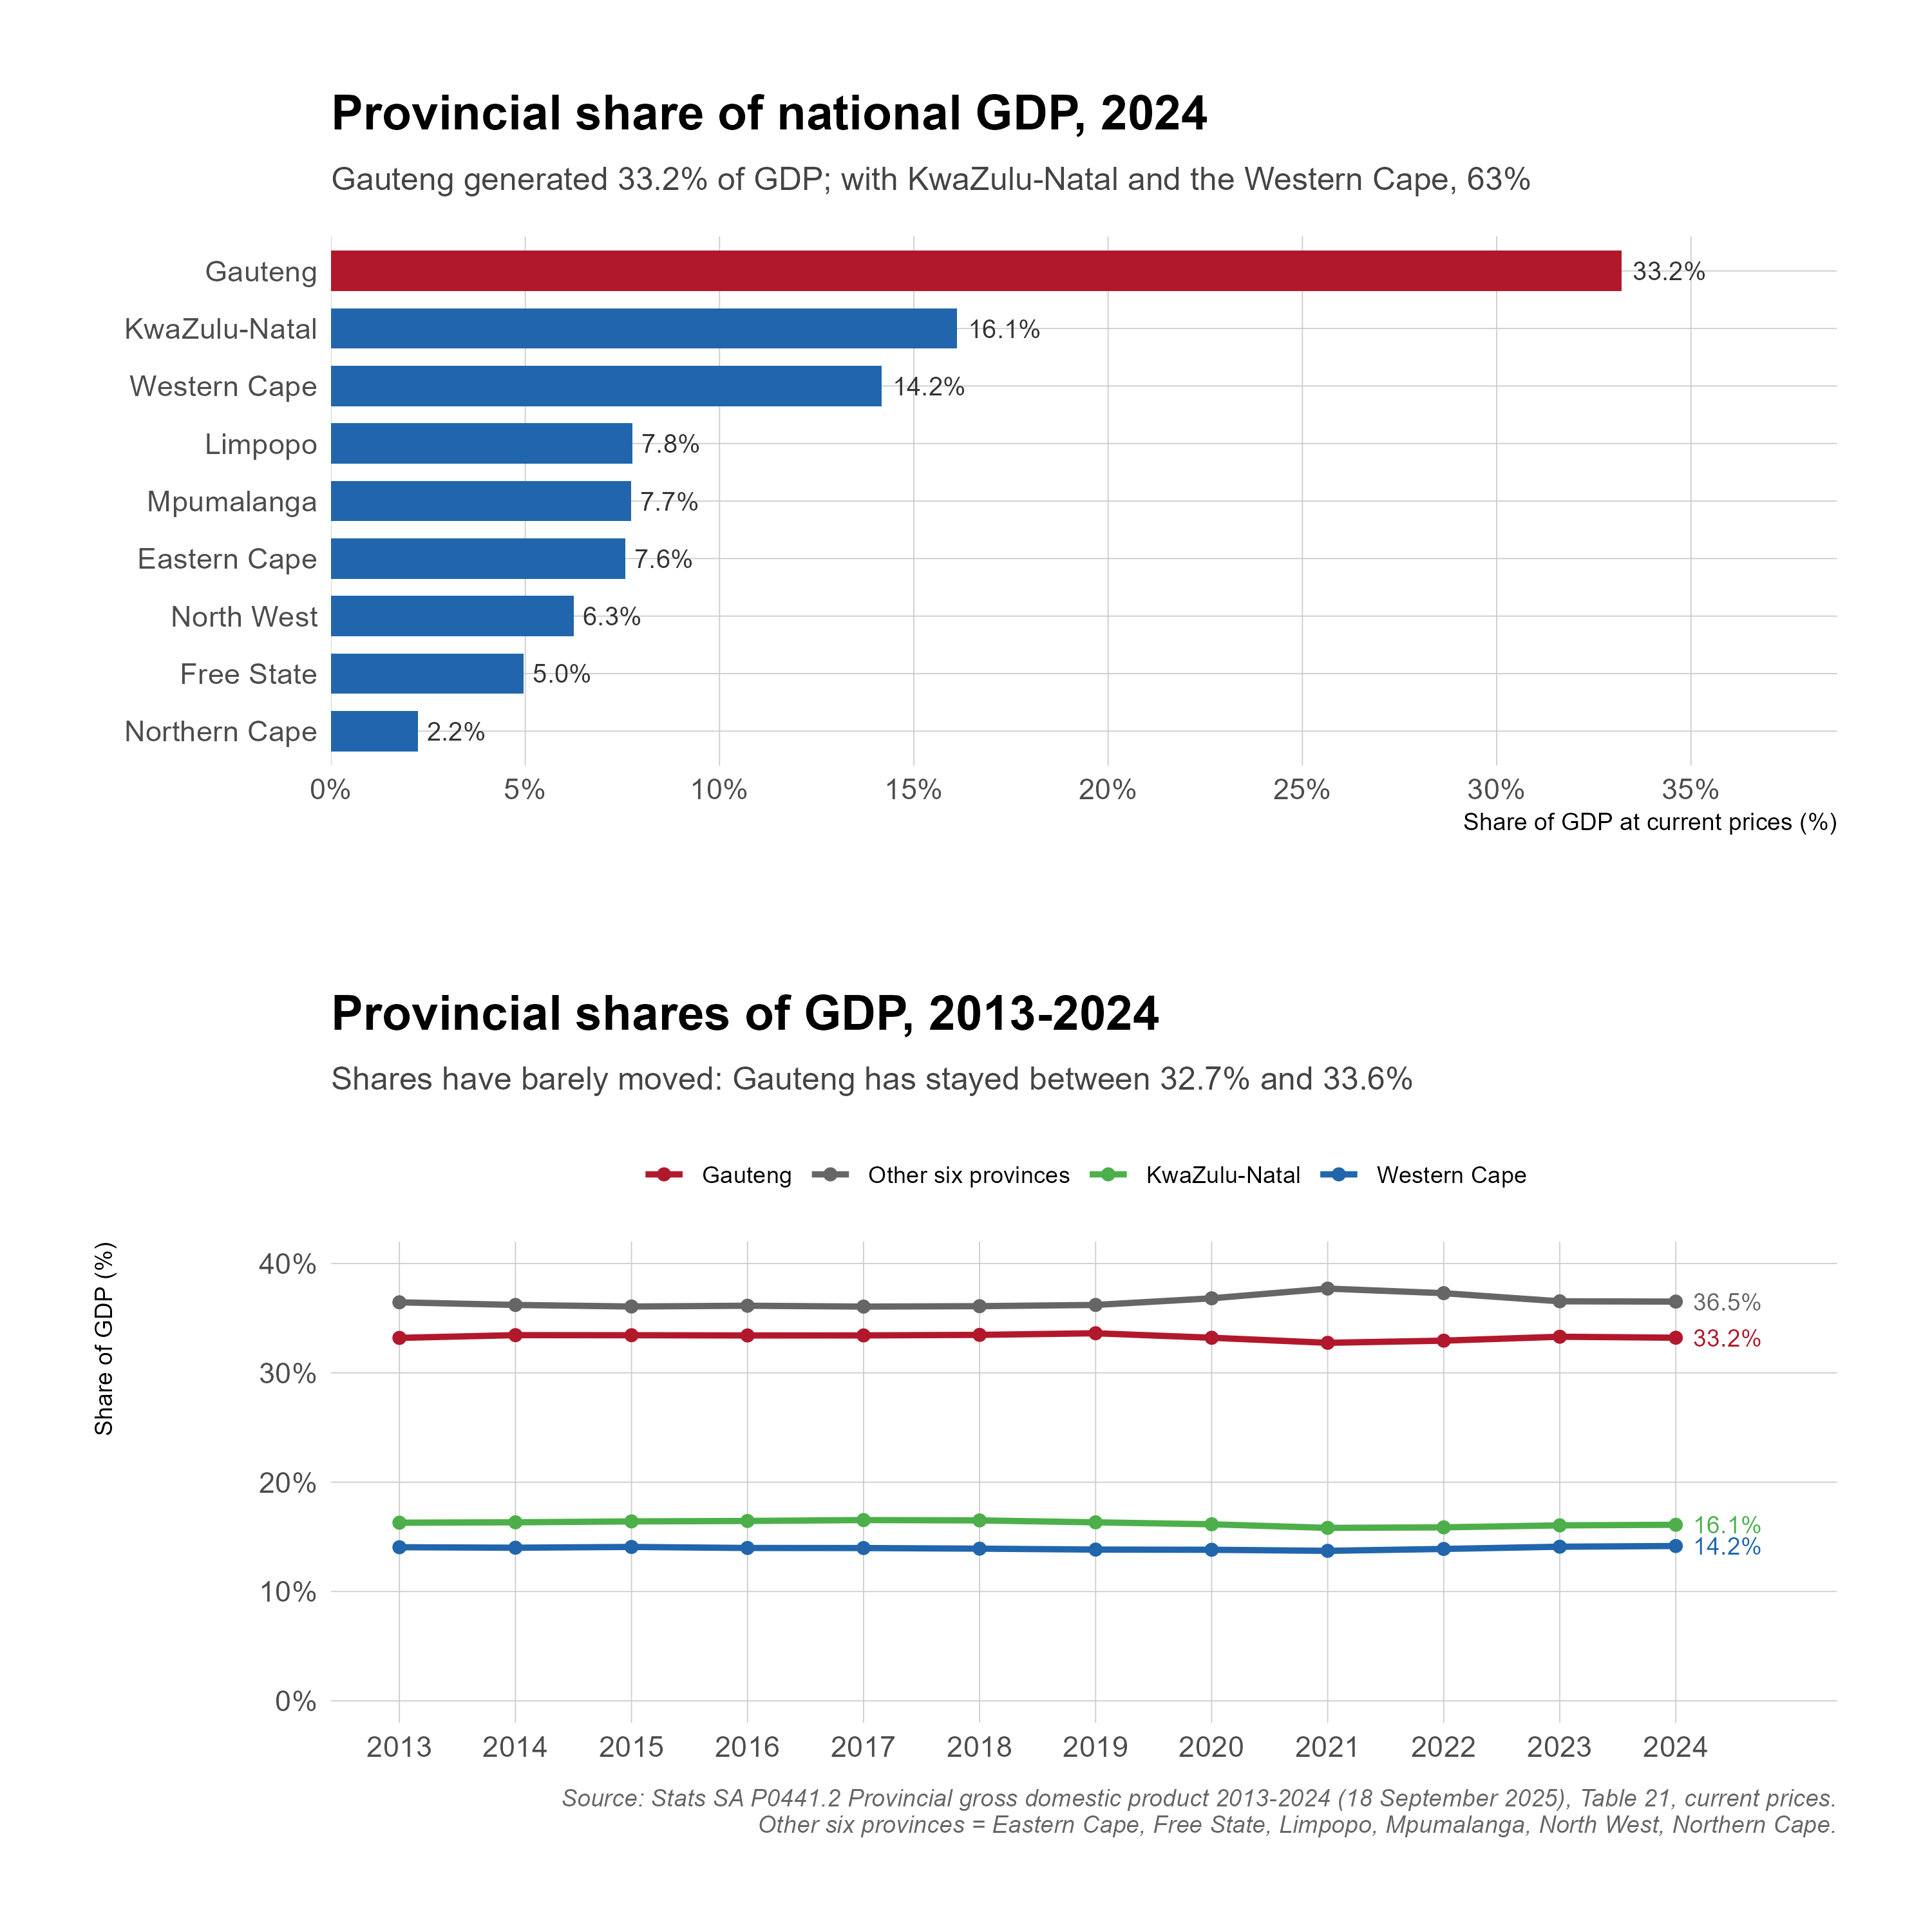
<figure><img src="/files/Up6LqVsp1DwLrTOGxHMI" alt="Bar chart showing provincial GDP shares with Gauteng dominating at 35% of national GDP, followed by KwaZulu-Natal at approximately 16% and Western Cape at 14%, illustrating stark spatial concentration of economic activity"><figcaption><p><strong>Figure 3.1:</strong> Provincial GDP Shares and Trends. <em>Gauteng dominates with 35% of national GDP, followed by KwaZulu-Natal and the Western Cape. This spatial concentration of economic activity has significant implications for infrastructure planning and service delivery.</em></p></figcaption></figure>

***

## II. The State-Owned Enterprise Landscape

South Africa has an extensive SOE portfolio spanning energy, transport, telecommunications, defence, and development finance (National Treasury 2024). These entities emerged in different eras for different purposes: strategic industrialisation under sanctions, service provision where markets were weak, and later developmental policy goals. Understanding their history, governance, and current constraints is essential context for the sectoral analysis that follows.

### A. Historical Context: From Apartheid Industrialisation to Developmental Mandate

Many of South Africa's major SOEs trace their origins to the apartheid era and even earlier (Fine and Rustomjee 1996). Eskom was established in 1923 to provide electricity for the mining industry. The South African Railways and Harbours (later Transnet) has roots in the colonial period. ISCOR (steel), SASOL (synthetic fuels), and Armscor (weapons) were created or expanded during the apartheid era to ensure self-sufficiency in strategic industries under conditions of international sanctions (Terreblanche 2002).

These enterprises were tools of the apartheid state's economic project (Terreblanche 2002). They provided infrastructure for mining and industry; they created employment for white workers (job reservation policies ensured that skilled positions were reserved for whites); and they developed technological capabilities that the regime deemed strategically necessary. They were, by design, instruments of racial capitalism.

The democratic transition created a dilemma: what to do with these inherited enterprises? The ANC's initial policy documents suggested nationalisation of key industries, but the negotiated settlement and subsequent policy choices moved in a different direction (Hirsch 2005). Rather than wholesale privatisation or nationalisation, the approach was "corporatisation"—restructuring SOEs as commercial entities operating under company law, while retaining state ownership.

The rationale for continued state ownership evolved. Initially it was defensive: avoid fire-sale privatisation outcomes seen in other transitions (Marais 2011). Over time, a developmental case became central: SOEs would extend services to excluded populations, cross-subsidise access, and support industrial policy. Eskom would electrify townships and rural areas, Telkom would extend communications, and Transnet would connect the economy.

This developmental mandate was real, and achievements were genuine. Electricity access expanded from around 37 percent of Black African households in 1994—even as white households were almost universally connected—to over 85 percent of all households by the 2010s, one of the most successful electrification programmes in the world (Statistics South Africa 2016). Dinkelman (2011) provides rigorous causal evidence of electrification's economic impact, showing that household electrification in KwaZulu-Natal increased female employment by approximately 9 percentage points—primarily by reducing time spent collecting fuel wood—demonstrating that infrastructure investment can directly address labour market exclusion.

But the mandate also created tensions: commercial imperatives versus developmental objectives; cost recovery versus affordability; efficiency versus employment creation. These tensions were never fully resolved.

### B. Governance and Shareholder Models

South Africa's SOEs operate under governance arrangements that have themselves been a source of dysfunction—and of repeated redesign (Department of Public Enterprises 2024). For most of the democratic era, the largest enterprises—including Eskom and Transnet—fell under the Department of Public Enterprises (DPE), whose minister acted as shareholder representative, while others reported to line ministries: the Post Office to Communications, the Land Bank to Agriculture, various development finance institutions to different departments. That centralised model was dismantled after the 2024 election. Under the Government of National Unity, the DPE was wound down: its state-owned companies were transferred to policy departments by presidential proclamation in August 2024—Eskom to the new Department of Electricity and Energy, Transnet (along with South African Airways) to the Department of Transport—and the department formally closed at the end of March 2025. The longer-planned alternative, a state holding company (State Asset Management SOC) to be created under the National State Enterprises Bill, remained before Parliament at the start of 2026. The oscillation of the shareholder model—centralised under the DPE, then dispersed back to line ministries while the holding company awaited legislation—is itself evidence of the unstable oversight arrangements this section describes.

This fragmented shareholder structure creates coordination problems (Presidential Review Committee on State-Owned Entities 2013). Different ministries have different priorities; oversight capacity varies; and no single entity takes a whole-of-government view of the SOE portfolio. Attempts to consolidate oversight—including the establishment of a Presidential SOE Council—have had limited effect.

Board appointments have been a central weakness. In principle, boards should include relevant commercial, technical, and financial expertise to set strategy and hold management accountable (OECD 2015). In practice, appointments often reflected political considerations over competence. ANC cadre deployment into strategic positions extended to SOE boards, sometimes with severe consequences (Chipkin and Swilling 2018).

The Zondo Commission documented how board appointments at Eskom, Transnet, SAA, and other entities were manipulated to install individuals sympathetic to corrupt networks (Zondo Commission 2022). Once captured, boards approved contracts that looted the enterprises, dismissed managers who resisted, and provided cover for systematic theft. The governance failure was not merely technical but political: the structures meant to ensure accountability were themselves corrupted.

### C. The Financial Crisis of SOEs

The cumulative result of governance failure, operational weakness, and developmental-mandate tensions has been a broad SOE financial crisis (National Treasury 2026). The pattern is familiar:

1. Operational inefficiency (poor maintenance, overstaffing, procurement failures) leads to declining performance;
2. Declining performance reduces revenues (fewer customers, lower volumes, price resistance);
3. Revenue shortfalls, combined with fixed costs and debt service, create cash flow crises;
4. Cash crises lead to further deferred maintenance and investment, worsening operational problems;
5. Eventually, the enterprise requires a government bailout to avoid collapse.

This cycle has repeated across entities (National Treasury 2024). Eskom received over R150 billion in direct fiscal support since 2008, plus R254 billion in debt relief in 2023 (National Treasury 2023). SAA consumed over R50 billion before restructuring. The Post Office, Denel, Land Bank, and others also required repeated support (Auditor-General South Africa 2023). Collectively, major SOEs accumulated R172 billion in losses over five years (National Treasury 2026). The picture has begun to shift—Eskom posted a R16 billion net profit in 2024/25, its first since 2016/17, and reduced its debt from R412.2 billion to R372.7 billion—but Transnet continues to fall short of its operational and financial targets. The Eskom profit figure, however, warrants critical scrutiny. It is substantially an accounting artefact of the R254 billion state debt-relief package, which removed the burden of servicing legacy debt, and of above-inflation tariff increases that have made South African electricity among the most expensive in Africa. Meanwhile, the revenue base is being structurally hollowed out: rooftop solar adoption continues to reduce grid sales, and municipal arrears—R94.6 billion and rising—represent revenue that may never be collected. The income statement has improved, but the balance sheet remains a sovereign risk factor (see Chapter 2's discussion of contingent liabilities).

Bailouts carry fiscal consequences examined in Chapter 2: higher debt and crowding out of developmental spending (National Treasury 2026). They also signal deeper failure: resources used to cover mismanagement are unavailable for future growth investment. The cycle tends to perpetuate dysfunction rather than resolve it.

Government guarantees add further risk (National Treasury 2026). The state has guaranteed substantial SOE debt—particularly Eskom's. If the enterprises cannot service this debt, the guarantee converts contingent liability into actual government debt. The credit rating agencies have cited SOE risks as a factor in South Africa's sovereign downgrade (IMF 2023).

***

## III. The Energy Crisis: Eskom and the Economy

No infrastructure failure has been more damaging than the electricity crisis (CSIR 2024; Eskom 2024). From 2007 through 2024, South Africa experienced recurring load shedding—planned rotational cuts when demand exceeded available supply. What began as intermittent disruption became a chronic emergency in 2022-2023, before an unexpected resolution: by mid-2025, load shedding had ceased entirely, and South Africa passed 200 consecutive days without cuts—a milestone many had thought impossible. The causes of the crisis combine historical underinvestment, failed build programmes, operational mismanagement, and corruption; its resolution reflects improved maintenance, the surge in private generation, and reduced demand from the self-generation boom.

### A. The Origins of Load Shedding

South Africa's electricity system was, for most of the twentieth century, characterised by abundant and cheap power (Fine and Rustomjee 1996). As Marquard (2007) documents in his comprehensive history of South African energy policy, cheap coal-fired electricity was not a natural endowment but a deliberate policy choice—one that locked in carbon-intensive infrastructure and suppressed demand-side efficiency for decades. Eskom built a fleet of large coal-fired power stations, drawing on the country's extensive coal reserves and providing some of the lowest electricity prices in the world. This cheap electricity powered the Minerals-Energy Complex (MEC) discussed in Chapter 1 and attracted energy-intensive industries like aluminium smelting.

The crisis originated in decisions—or non-decisions—made in the 1990s and early 2000s. In the late apartheid period, Eskom had excess generation capacity, having overbuilt in anticipation of economic growth that sanctions interrupted. After the transition, demand grew as the economy expanded and millions of households were electrified. But new generation capacity was not built.

The reasons for this investment failure are debated. Some argue that government delayed decisions about new capacity because it was considering restructuring Eskom—potentially unbundling generation from transmission and introducing competition. Others point to capital constraints and competing priorities. Whatever the cause, by the mid-2000s it was clear that demand would soon exceed supply, and Eskom belatedly began planning new capacity.

The response was the "new build" programme: Medupi and Kusile plus return-to-service of three mothballed stations. The outcome was catastrophic (Eskom 2024). Medupi and Kusile were budgeted at roughly R163 billion combined but are expected to exceed R450 billion. Timelines stretched from 6-7 years to over 15, and commissioned units had major design defects requiring further repair. Overruns reflected weak project management, contractor disputes, design changes, and alleged procurement corruption (Zondo Commission 2022).

### Case Study: Medupi and Kusile — Anatomy of a Mega-Project Failure

Medupi and Kusile deserve closer examination because they illustrate how institutional failures compound across technical, managerial, and governance dimensions. Medupi, in Limpopo, was designed as a six-unit, 4,764 MW dry-cooled coal plant — at the time the largest of its kind globally. Kusile, near eMalahleni in Mpumalanga, was a near-identical design at 4,800 MW with the addition of flue-gas desulphurisation. Both were approved in 2007 when reserve margins had already turned negative.

The projects suffered from cascading failures. First, Eskom had not built a major power station since the 1980s and had lost the institutional knowledge required for mega-project management. Key engineering staff had departed during the 1990s restructuring, and the project management teams assembled for Medupi and Kusile lacked deep experience with projects of this scale. Second, boiler design defects — including weld defects across units that required thousands of repairs — emerged after construction, delaying commissioning by years and requiring costly rework (Eskom 2024). Third, the Zondo Commission documented how procurement corruption inflated costs: contracts were awarded to politically connected firms at above-market rates, subcontractors were imposed on prime contractors, and project oversight was compromised by executives who prioritised patronage over delivery (Zondo Commission 2022).

The opportunity cost was enormous. By 2024, the combined overrun — roughly R300 billion above original estimates — exceeded South Africa's entire annual education budget. Had Eskom invested in maintaining existing plant and procuring renewable energy at 2015 prices, it could have added equivalent capacity at a fraction of the cost and avoided the worst years of load shedding. The Medupi/Kusile experience became the defining cautionary tale for state-led industrial mega-projects in South Africa, reinforcing the case for private participation and distributed generation that Chapter 3's policy discussion explores.

### B. Operational Collapse: The EAF Crisis

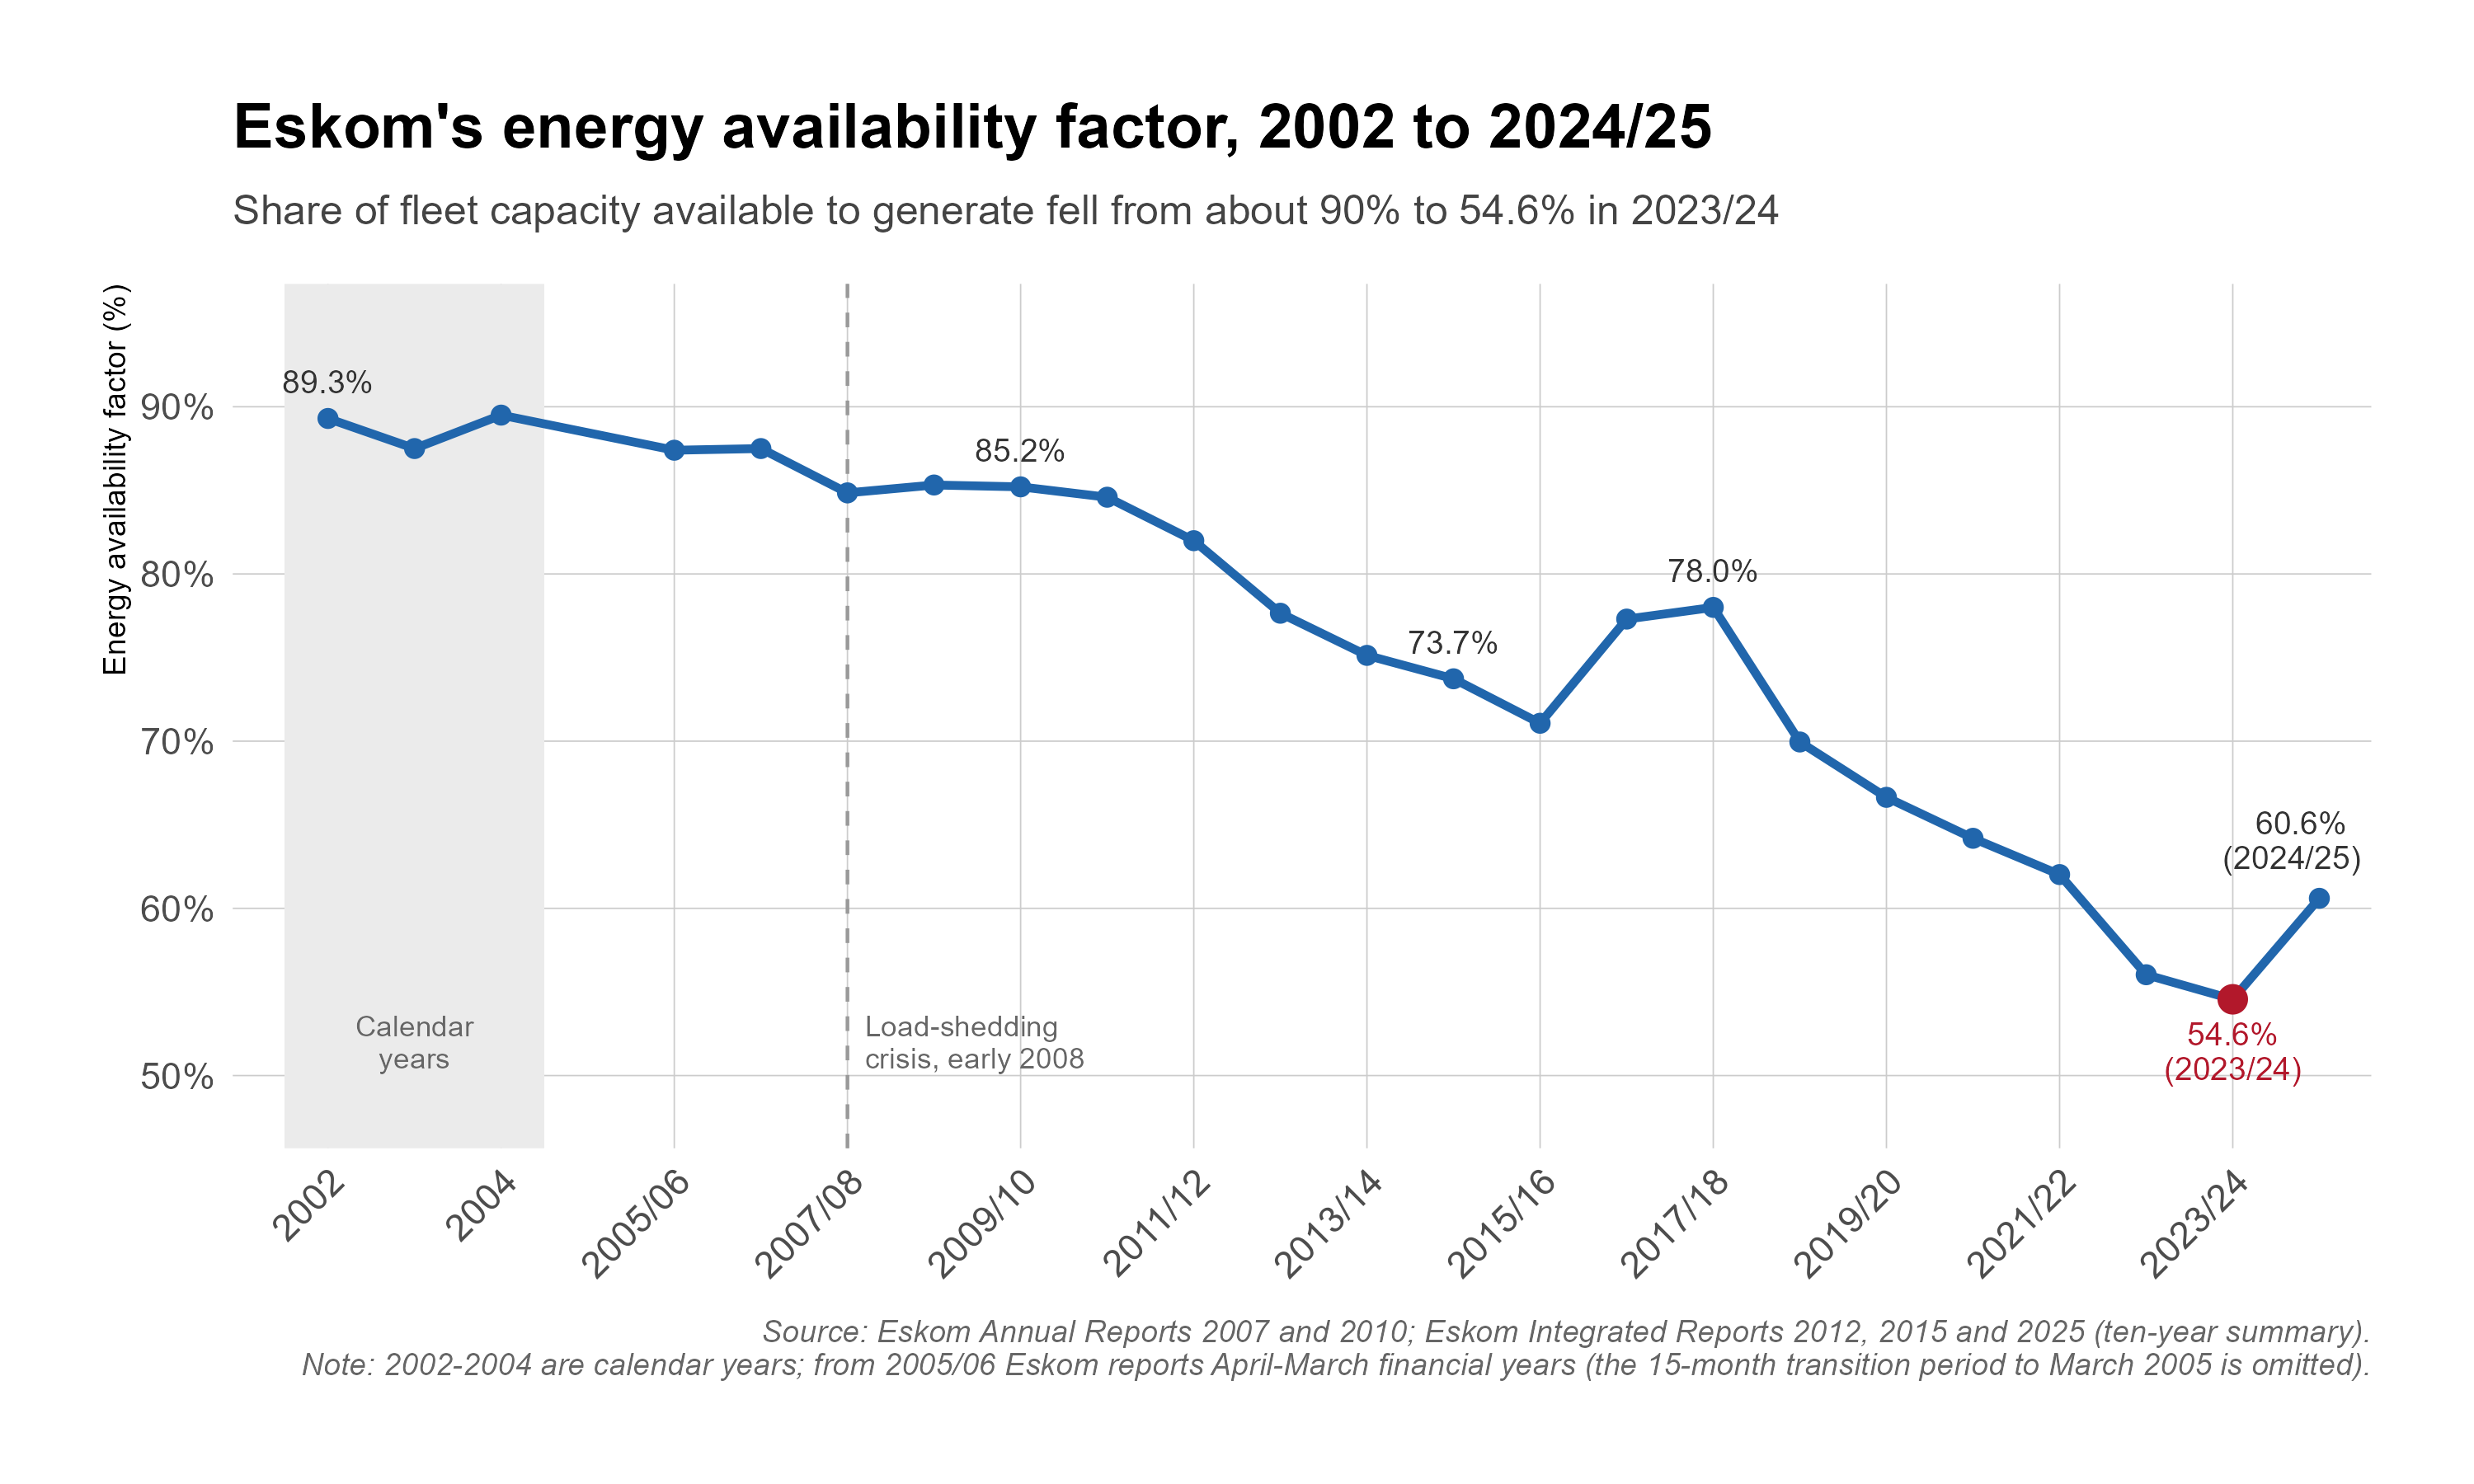
As the new build faltered, Eskom's existing fleet also deteriorated (Eskom 2024). Energy Availability Factor (EAF)—the share of installed capacity available to generate—fell from around 90 percent in the early 2000s to a historic low of 53 percent in 2023 (CSIR 2024; Eskom 2025). The decline reflected deferred maintenance, aging-plant failures, and stress from running units beyond design limits. Improved maintenance programmes and the commissioning of additional Medupi and Kusile units contributed to a recovery in EAF through 2024-2025, which—combined with reduced grid demand as private solar and embedded generation expanded—enabled the end of load shedding.

**Figure 3.2** shows the EAF trajectory, illustrating the long-term decline in available generation capacity.

<figure><img src="/files/UxwBXGvLEbIPNiIRuLM5" alt="Line chart showing Eskom&#x27;s Energy Availability Factor declining from around 90% in the early 2000s to a historic low of 53% in 2023, representing loss of over 40% of generation capacity due to deferred maintenance and plant breakdowns"><figcaption><p><strong>Figure 3.2:</strong> Eskom Energy Availability Factor. <em>Source: Eskom, CSIR. Note: The Energy Availability Factor declined from around 90% in the early 2000s to 53% in 2023, representing a loss of over 40% of theoretical generation capacity.</em></p></figcaption></figure>

> **53% → recovery** — Eskom's Energy Availability Factor hit a historic low of 53% in 2023, down from around 90% in the early 2000s, before recovering as maintenance improved. By mid-2025, the combination of improved EAF, new capacity, and reduced grid demand from private generation ended load shedding entirely.

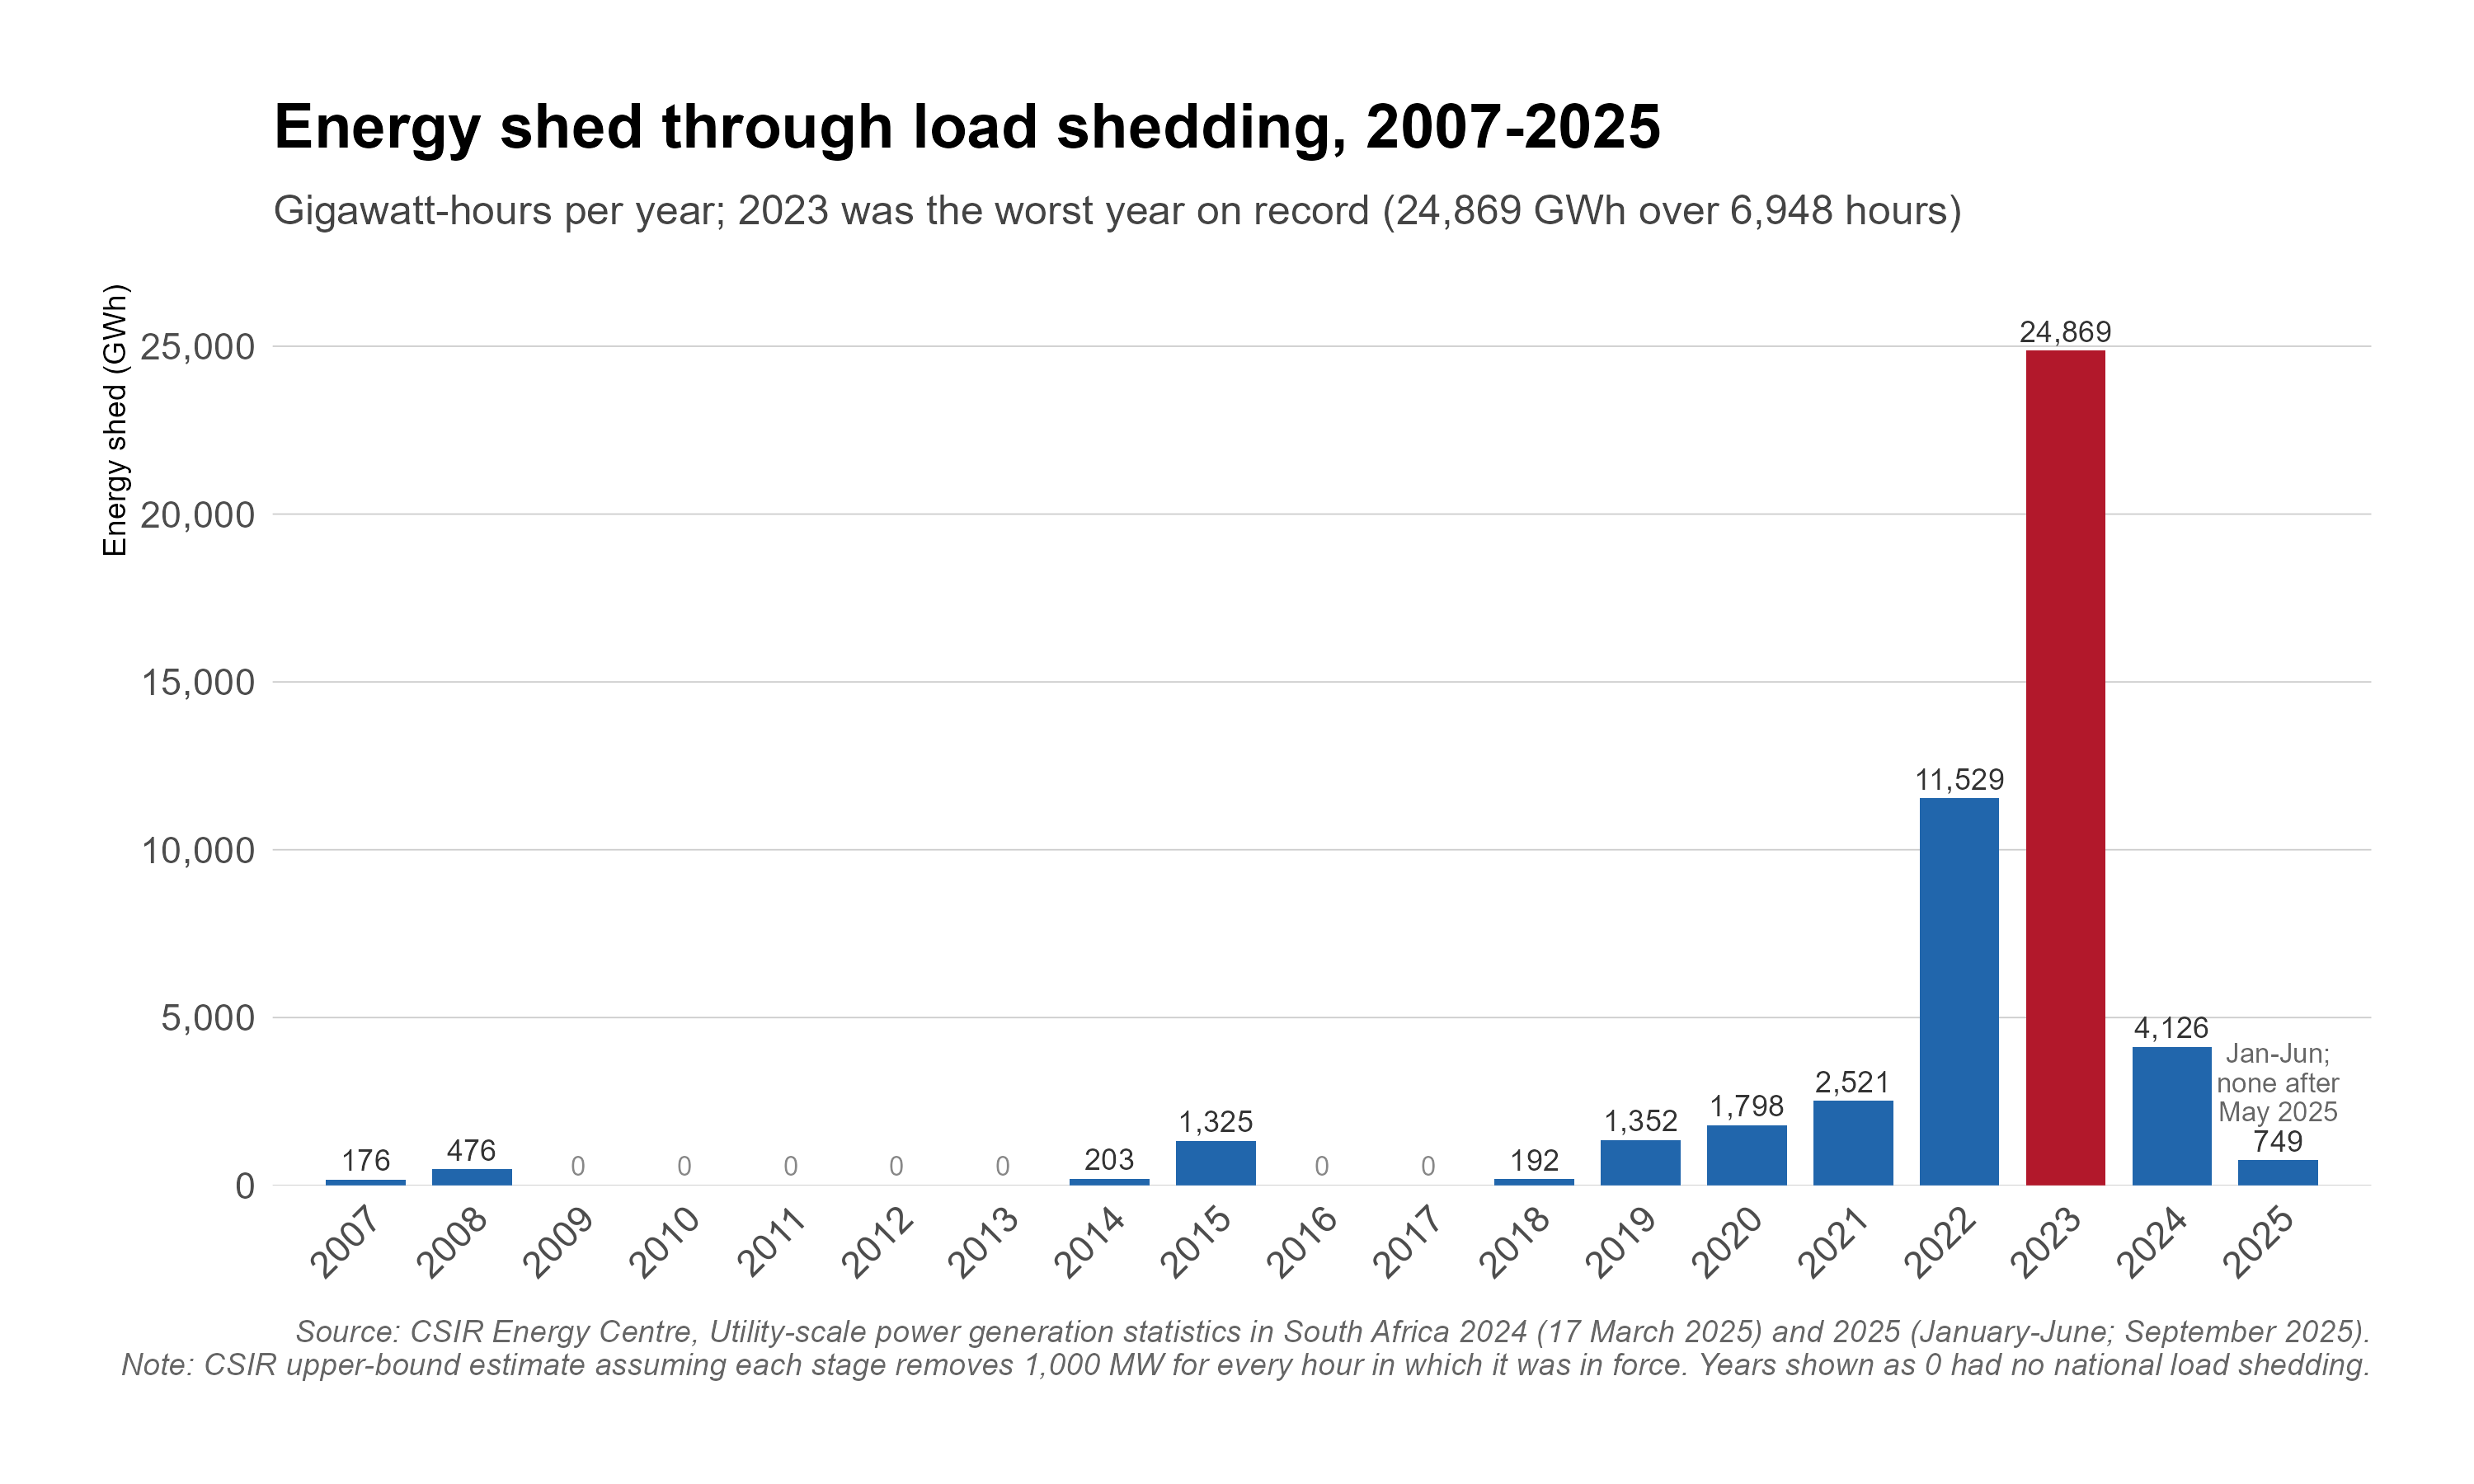
The immediate consequence of low EAF was load shedding (Eskom 2024). When supply could not meet demand, Eskom imposed rotational cuts to prevent full grid collapse. Each stage equalled roughly 1,000 MW. Stage 6—reached repeatedly in 2022-2023—cut 6,000 MW, about a quarter of typical demand. The system reached breaking point before conditions improved: load shedding days fell from 332 in the worst year to fewer than 15 in 2024/25, and then ceased entirely (National Treasury 2026).

**Figure 3.3** shows the intensity of load shedding over time, measured in gigawatt-hours of electricity not supplied.

<figure><img src="/files/opwcSWQSQy75txVN71qE" alt="Bar chart showing annual load shedding intensity in GWh from 2007-2024, with dramatic escalation to approximately 16,000 GWh in 2023 representing the worst year on record, equivalent to annual consumption of many small countries"><figcaption><p><strong>Figure 3.3:</strong> Load Shedding Intensity. <em>Source: CSIR, Eskom. Note: Load shedding reached crisis levels in 2022-2023, with approximately 16,000 GWh shed in 2023 alone—equivalent to the total annual consumption of many small countries.</em></p></figcaption></figure>

The economic costs of load shedding were difficult to measure precisely but clearly large (CSIR 2024; South African Reserve Bank 2024). Bhorat and Kohler (2024) show direct labour-market effects, with load shedding suppressing job creation. Direct costs included lost production, spoilage, and backup power; indirect costs included lower investment, tourism losses, and higher uncertainty. Estimates placed annual losses at 2-5 percent of GDP during the worst years (CSIR 2024). Budlender (2024) adds causal evidence of health effects, showing that reduced blackouts lower mortality. Bohlmann et al. (2019) find that the coal-to-renewables transition has major regional effects, especially in Mpumalanga, with labour-migration implications.

The end of load shedding in 2025 removed one of the most visible constraints on economic activity. But the legacy costs are substantial: years of underinvestment, lost production, emigration of skilled workers, and the sunk costs of backup generation by firms and households cannot be quickly recovered. Whether the current stability is durable depends on continued maintenance, the pace of new capacity additions, and the resolution of grid-connection bottlenecks for renewable and embedded generation.

{% hint style="info" %}
**Turning point:** After reaching crisis levels in 2022-2023, load shedding ended entirely by mid-2025. Eskom posted its first net profit since 2016/17—R16 billion in 2024/25—and reduced its debt from R412.2 billion to R372.7 billion. Load shedding days fell from 332 at the 2023 peak to fewer than 15 in 2024/25, and to zero once cuts ceased entirely in mid-2025. The crisis is not fully resolved—Eskom's ageing fleet remains vulnerable and municipal arrears reached R94.6 billion—but the acute phase has passed.
{% endhint %}

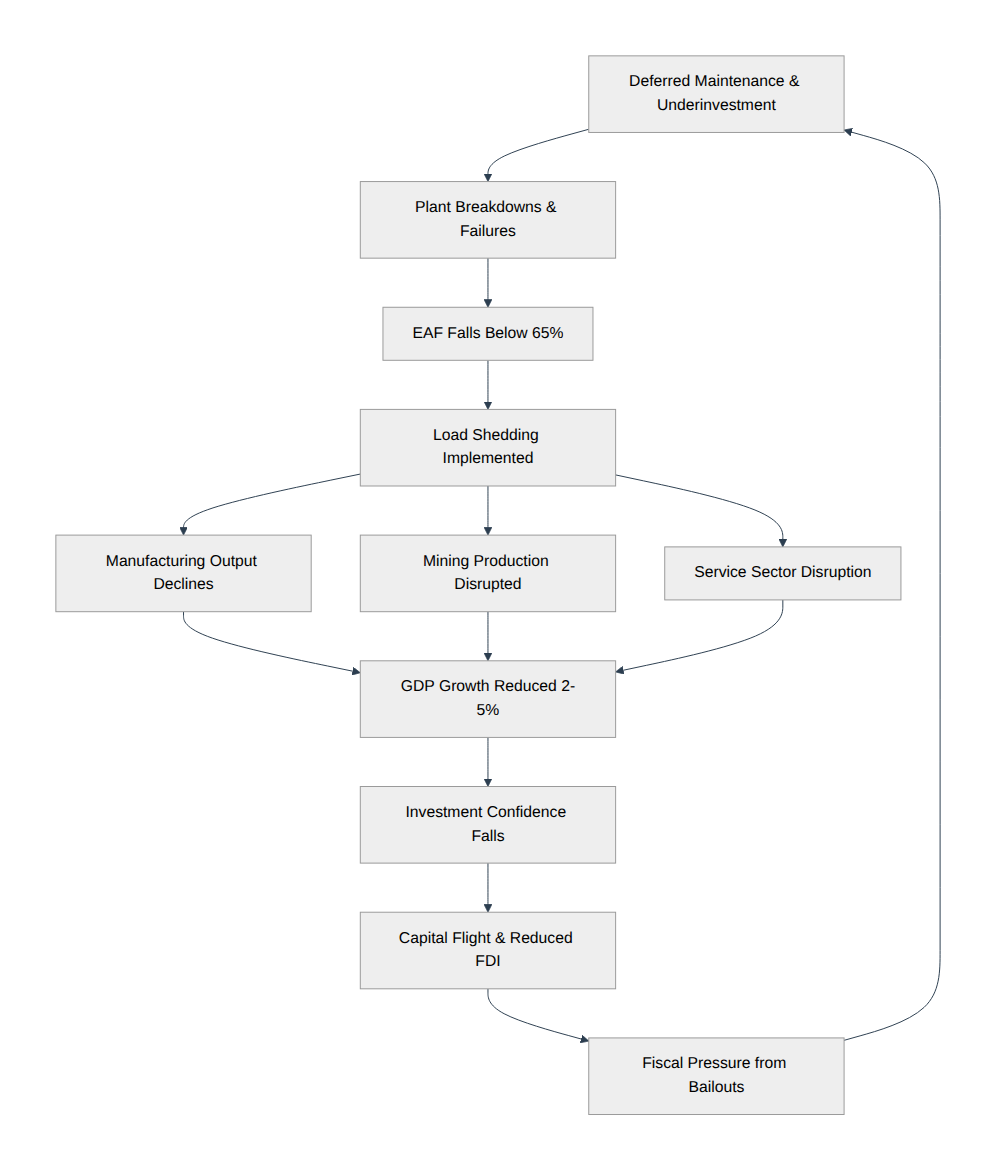
#### The Energy Crisis Cascade

The following diagram illustrates how Eskom's operational failures cascade through the economy:

<figure><img src="https://mermaid.ink/img/Zmxvd2NoYXJ0IFRECiAgICBBW0RlZmVycmVkIE1haW50ZW5hbmNlICYgVW5kZXJpbnZlc3RtZW50XSAtLT4gQltQbGFudCBCcmVha2Rvd25zICYgRmFpbHVyZXNdCiAgICBCIC0tPiBDW0VBRiBGYWxscyBCZWxvdyA2NSVdCiAgICBDIC0tPiBEW0xvYWQgU2hlZGRpbmcgSW1wbGVtZW50ZWRdCiAgICBEIC0tPiBFW01hbnVmYWN0dXJpbmcgT3V0cHV0IERlY2xpbmVzXQogICAgRCAtLT4gRltNaW5pbmcgUHJvZHVjdGlvbiBEaXNydXB0ZWRdCiAgICBEIC0tPiBHW1NlcnZpY2UgU2VjdG9yIERpc3J1cHRpb25dCiAgICBFIC0tPiBJW0dEUCBHcm93dGggUmVkdWNlZCAyLTUlXQogICAgRiAtLT4gSQogICAgRyAtLT4gSQogICAgSSAtLT4gSltJbnZlc3RtZW50IENvbmZpZGVuY2UgRmFsbHNdCiAgICBKIC0tPiBLW0NhcGl0YWwgRmxpZ2h0ICYgUmVkdWNlZCBGREldCiAgICBLIC0tPiBMW0Zpc2NhbCBQcmVzc3VyZSBmcm9tIEJhaWxvdXRzXQogICAgTCAtLT4gQQ" alt="Energy Crisis Cascade Diagram"><figcaption><p><em>The energy crisis cascade: how infrastructure failure leads to economic damage in a vicious cycle.</em></p></figcaption></figure>

*The energy crisis creates a vicious cycle: infrastructure failure leads to economic damage, which reduces investment and fiscal capacity, which prevents the maintenance and investment needed to fix the infrastructure.*

### C. Market Structure Reform: Unbundling and IPPs

The crisis has accelerated reforms that were long debated but never implemented (The Presidency 2020-2024). Eskom has been formally unbundled into three separate entities: Generation, Transmission, and Distribution. The transmission entity—the National Transmission Company of South Africa (NTCSA)—operates as an independent system and market operator, creating the structural conditions for competition in generation.

More immediate has been opening the market to Independent Power Producers (IPPs) (Department of Mineral Resources and Energy 2024). REIPPPP, launched in 2011, has procured over 6,000 MW of renewables through competitive bidding. As technology improved and competition intensified, bid prices for solar and wind fell below Eskom's average generation cost (CSIR 2024).

The most significant reform was the 2021-2022 liberalisation of embedded generation, allowing firms and households to generate electricity without prior licensing constraints (The Presidency 2020-2024). This triggered a private-investment surge in rooftop and larger-scale solar. Estimates suggest over 6,000 MW was installed or committed within two years—more than formal procurement delivered over much of the prior decade (CSIR 2024). The contribution of this private generation to ending load shedding is difficult to quantify precisely, but the reduction in grid demand was a significant factor alongside Eskom's improved maintenance.

These reforms mark a structural shift from a vertically integrated state monopoly towards a more competitive multi-generator model. The transition remains incomplete—grid connection bottlenecks, regulatory uncertainty, and institutional resistance persist—but the end of load shedding demonstrates that the reformed model can deliver results (The Presidency 2020-2024; National Treasury 2026).

### Comparative Policy Box: Vietnam's Power Sector Expansion

Vietnam offers a relevant comparison for electricity sector development. Like South Africa, Vietnam faced rapidly growing electricity demand that threatened to outstrip supply. Unlike South Africa, Vietnam managed a massive capacity expansion while maintaining supply reliability:

* **Clear planning**: Vietnam's Power Development Plans set explicit capacity targets with accountability for delivery;
* **Diversified sources**: Investment in hydro, coal, gas, and increasingly renewables provided redundancy;
* **Private participation**: From the early 2000s, Vietnam welcomed private investment in generation through BOT (Build-Operate-Transfer) arrangements;
* **Competitive procurement**: Recent solar and wind procurement has achieved prices comparable to fossil fuels;
* **Grid investment**: Transmission infrastructure expanded alongside generation.

The results speak for themselves: Vietnam has largely avoided load shedding despite demand growth exceeding 10 percent annually for extended periods—though the power shortages in northern Vietnam in mid-2023, driven by a drought-induced hydropower shortfall, showed the risks inherent in the model.

For South Africa, the lessons include: the importance of sustained investment ahead of demand; the value of private sector participation to augment state capacity; the need for diverse generation sources; and the critical role of transmission infrastructure in integrating new capacity.

### D. The Just Energy Transition

South Africa's electricity system is heavily coal-dependent, with coal plants providing approximately 75 percent of generation (Department of Mineral Resources and Energy 2024). This creates a tension between energy security and climate commitments. The country is among the world's largest per-capita emitters of greenhouse gases, primarily due to coal combustion (IEA 2024).

The Just Energy Transition (JET) framework attempts to reconcile these competing imperatives (The Presidency 2022). The JET Investment Plan, announced at COP26 in 2021 with initial international financing commitments of $8.5 billion, envisions accelerated retirement of coal plants, expanded renewable capacity, and support for affected communities—particularly in Mpumalanga province, where coal mining and power generation are concentrated.

Montmasson-Clair (2024) argues that South Africa faces not one transition but three interconnected ones: electricity (coal to decentralised renewables), coal value chains (miners, transporters, and local economies), and economy-wide decarbonisation across sectors. Conflating them weakens policy design because each needs distinct instruments and governance, despite interdependence. This "three transitions" framework offers a more precise analytical lens (Montmasson-Clair 2021, 2022).

The "just" element of the transition is critical. Coal mining employs approximately 90,000 workers directly, with many more in related industries and communities (Minerals Council South Africa 2024). Mpumalanga towns built around coal face the prospect of economic devastation if mines and plants close without alternatives. The JET framework includes provisions for worker retraining, economic diversification, and social support—though implementation details remain contested (The Presidency 2022). Research by TIPS on Mpumalanga's coal-dependent municipalities—eMalahleni, Steve Tshwete, Govan Mbeki, and Msukaligwa—documents both the historical dependence and potential diversification pathways (Montmasson-Clair et al. 2024).

The decommissioning of the Komati power station in Mpumalanga—the first concrete pilot under the JET framework, supported by World Bank financing—has provided an early test case. The project has faced sustained local criticism over job losses and the pace of alternative livelihood programmes, illustrating the gap between transition planning at the national level and its social consequences on the ground. Komati serves as a cautionary example: if the transition cannot be managed credibly at a single station, scaling it across the coal fleet will face far greater resistance.

Winkler (2017) argues that South Africa's energy transition is fundamentally a political economy challenge rather than a technical one: the concentrated costs falling on coal-dependent communities and Eskom's workforce create opposition that diffuse climate benefits struggle to overcome. His earlier work designing South Africa's carbon tax framework (Winkler et al. 2011) demonstrated that pricing instruments alone are insufficient without complementary industrial policy and social protection—a lesson the JETP architects appear to have absorbed, at least on paper (Winkler and Marquard 2009).

The transition also faces practical challenges. Retiring coal plants before reliable alternatives are available would worsen the electricity crisis. The grid infrastructure needed to integrate large-scale renewables requires investment (CSIR 2024). Storage solutions (batteries, pumped hydro) are needed to address renewable intermittency. And the financing—while substantial—may not be sufficient for the scale of transformation required (World Bank 2022).

***

## IV. Transport and Logistics: Transnet and the Freight System

If electricity is South Africa's most visible infrastructure crisis, logistics may be the most damaging for external competitiveness (Transnet 2024; World Bank 2023). As a resource exporter, South Africa depends on moving bulk commodities from inland mines to ports. The rail-port system has deteriorated sharply, raising costs economy-wide.

### A. The Rail-Road Shift

South Africa inherited a substantial rail network built mainly for mining. Rail is generally more efficient than road for long-distance bulk freight: lower fuel use, lower emissions, and lower per-tonne-kilometre cost. A functioning rail system is therefore a core competitive advantage for a mineral exporter.

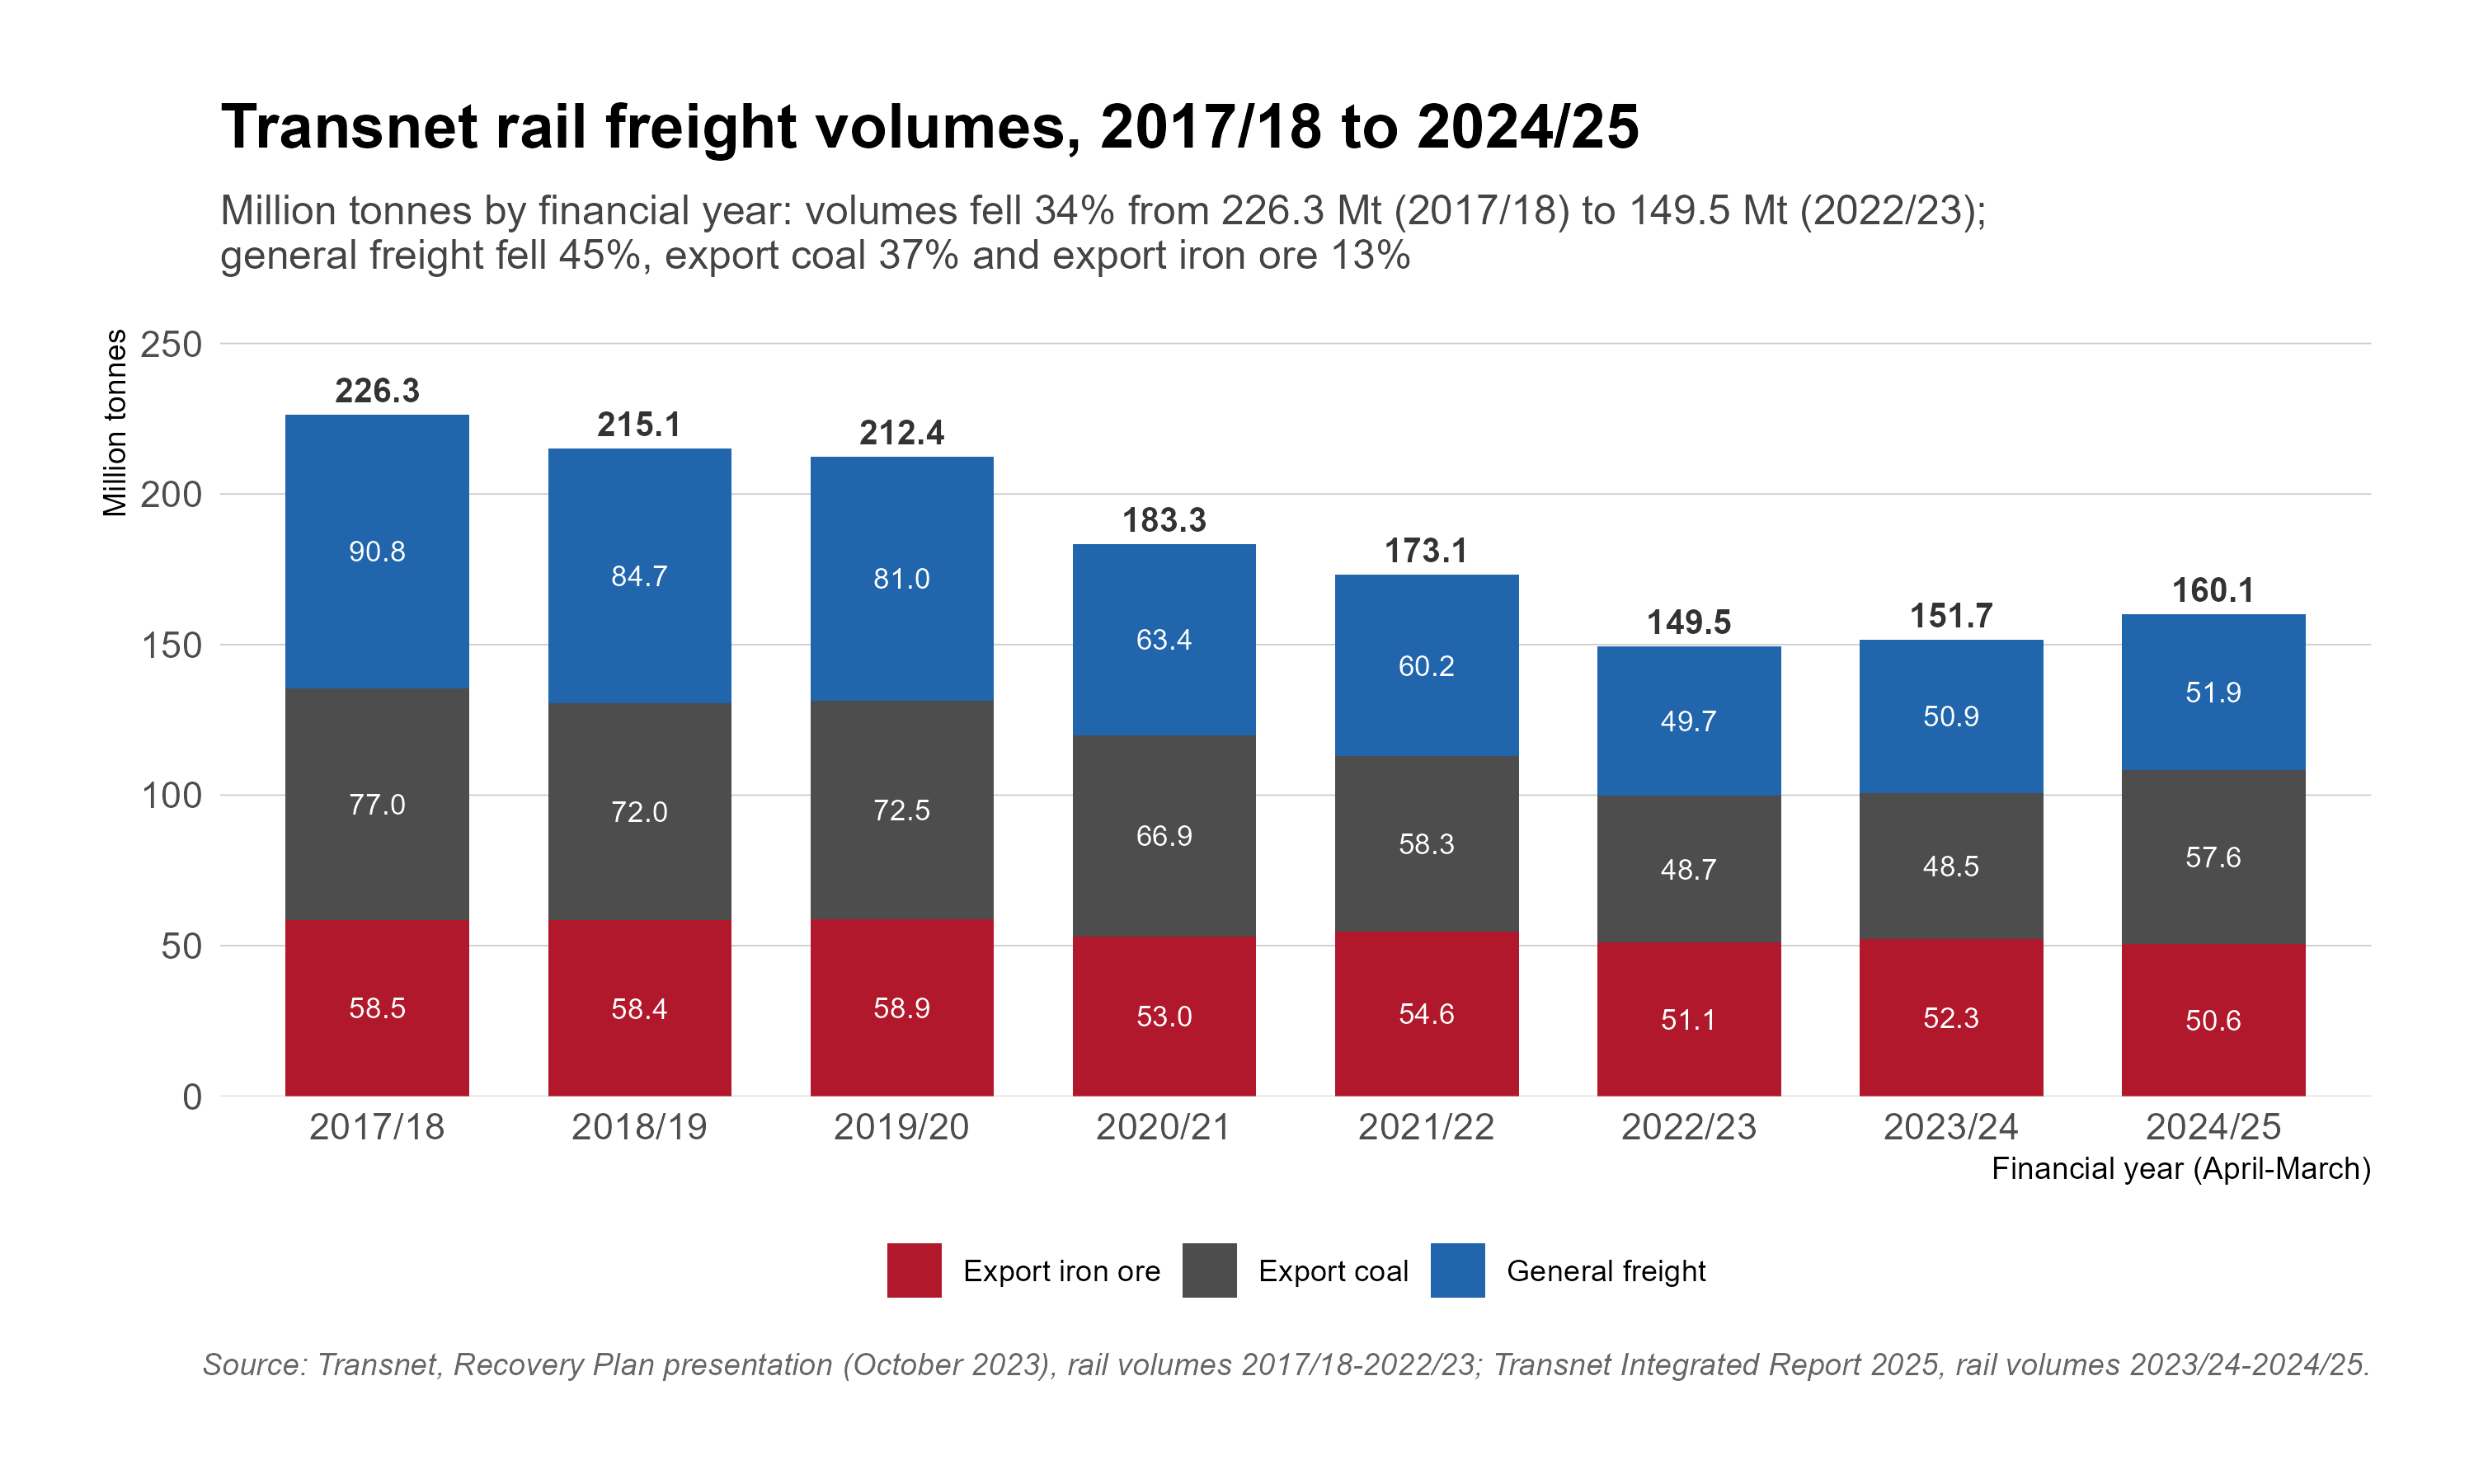
**Figure 3.4** shows the decline in rail freight volumes, reflecting Transnet's operational difficulties.

<figure><img src="/files/H2SzWPqzCvWf5Qx8ktD5" alt="Line chart showing Transnet rail freight volumes declining by roughly one-third from their mid-2010s peak to the 2022/23 trough, with coal and general freight showing sharpest declines due to locomotive shortages and infrastructure deterioration, and a modest recovery thereafter"><figcaption><p><strong>Figure 3.4:</strong> Transnet Rail Freight Volumes. <em>Source: Transnet, Stats SA. Note: Rail freight volumes fell by roughly one-third from their mid-2010s peak (226 million tonnes in 2017/18) to the 2022/23 trough of 149.5 million tonnes, with particularly sharp drops in general freight and coal; a modest recovery began thereafter.</em></p></figcaption></figure>

> **34%** — The decline in rail freight volumes from their mid-2010s peak (226 million tonnes in 2017/18) to the 2022/23 trough (149.5 million tonnes), forcing cargo onto an already overburdened road network and increasing export costs.

As rail has become unreliable, freight has shifted to road (Transnet 2024). This shift imposes multiple costs:

* **Direct costs**: Road transport is more expensive per tonne-kilometre than rail, increasing the cost of moving goods;
* **Road damage**: Heavy trucks cause disproportionate damage to road surfaces, accelerating deterioration of the road network (SANRAL 2024);
* **Congestion**: More trucks mean more congestion, slowing all road users;
* **Environmental**: Road freight produces more emissions per tonne-kilometre than rail;
* **Safety**: Heavy trucks are involved in a disproportionate share of fatal road accidents (Road Traffic Management Corporation 2024).

The rail-to-road shift therefore imposes economy-wide negative externalities: costs borne beyond the immediate transport users.

### B. The Causes of Rail Decline

Transnet Freight Rail's decline reflects multiple factors (Transnet 2024):

**Underinvestment and maintenance backlogs**: Like Eskom, Transnet deferred maintenance during financially constrained years, and the accumulated backlog has become operationally crippling. Locomotives, wagons, and track infrastructure all require rehabilitation.

**Corruption and state capture**: The Zondo Commission documented extensive corruption at Transnet, most notoriously in the procurement of 1,064 locomotives, a contract split across four original equipment manufacturers—CSR and CNR of China, Bombardier, and General Electric (Zondo Commission 2022). The contract, valued at R54 billion, was inflated by billions of rand in kickbacks and involved technically inappropriate locomotives. The scandal exemplifies how state capture diverted resources that should have maintained and improved the system.

**The CRRC spare parts crisis**: Beyond procurement corruption, the locomotive deal created a persistent operational failure. The locomotives supplied by CRRC (the Chinese manufacturer formed from the merger of CSR and CNR) required specialised parts unavailable from alternative suppliers. Contract disputes over price and performance led to shortages that grounded hundreds of locomotives in 2022-2024 (Transnet 2024). This specific contractual failure, separate from broader maintenance backlogs, materially deepened the freight collapse and illustrates how bad procurement creates long-tail operational risk.

**Security and theft**: Cable theft has reached epidemic proportions, with copper signalling cables stripped from rail lines and sold for scrap (Transnet 2024). Vandalism affects infrastructure across the network. The security breakdown reflects both the value of metals and the inadequacy of protection—itself a symptom of institutional weakness.

**Skills loss**: Experienced managers and technical staff have left Transnet, either pushed out during state capture or attracted by private sector opportunities. Institutional knowledge has been lost (Chipkin and Swilling 2018).

### C. Port Congestion and Global Rankings

South Africa's ports—Durban, Richards Bay, Cape Town, Ngqura, and others—are critical nodes in the logistics chain. Their performance has deteriorated markedly (Transnet Port Terminals 2024). The World Bank's Container Port Performance Index ranked Durban, Africa's busiest container port, 398th out of 405 ports in its 2023 edition—effectively among the worst-performing ports in the world (World Bank 2023).

The causes of port inefficiency include:

* **Equipment problems**: Cranes and other cargo-handling equipment are poorly maintained or obsolete (Transnet 2024);
* **Labour issues**: Work stoppages and low productivity have been recurring problems;
* **Rail connections**: Port capacity is constrained when rail cannot move cargo in and out efficiently;
* **Management**: Operational decisions have prioritised political over commercial considerations (Chipkin and Swilling 2018).

The consequences are severe for trade. Shipping lines have imposed congestion surcharges on South African ports, adding to the cost of exports and imports. Some lines have reduced service, limiting options for shippers. Lead times have become unpredictable, disrupting supply chains. For time-sensitive exports like fresh produce, port delays can mean spoilage and lost markets (Department of Trade, Industry and Competition 2024).

### D. The Reform Agenda

Recognising the crisis, government has initiated reforms, many under the Operation Vulindlela framework (The Presidency 2020-2024):

**Third-party access**: The rail network is being opened to private operators (The Presidency 2020-2024). Rather than Transnet monopolising rail freight, private companies will be able to run trains on the network, subject to capacity allocation and safety regulation. Early private operations have already begun on some corridors.

**Port privatisation**: Private sector participation in port terminals is advancing, though slowly (The Presidency 2020-2024). The flagship transaction concerns Durban Container Terminal Pier 2, which handles roughly 70 percent of the Port of Durban's container throughput and close to half of South Africa's container traffic. In July 2023, Transnet selected International Container Terminal Services Inc. (ICTSI) of the Philippines as its partner in a 25-year joint venture—Transnet retaining 51 percent, ICTSI holding 49 percent—to operate and upgrade the terminal. Implementation then stalled in litigation: the losing bidder, APM Terminals, obtained a High Court interdict in October 2024 blocking the deal, and only in October 2025 did the KwaZulu-Natal High Court dismiss its challenge to the tender. Transnet and ICTSI signed the partnership agreement in December 2025, and the management transition began in January 2026—more than two and a half years after the bidder was selected. Similar arrangements are planned at other terminals.

**Governance reforms**: Transnet's board has been reconstituted, and new management appointed (Transnet 2024). The organisational culture is being addressed, though changing an institution's culture takes time.

Progress is real but slow. Private rail operations are beginning; the Pier 2 concession, after two years in the courts, is finally being implemented; management is improving. Rail volumes have turned upward—from a trough of 149.5 million tonnes in 2022/23 to 151.7 million tonnes in 2023/24 and 160.1 million tonnes in 2024/25—but the latest figure still missed Transnet's 170-million-tonne target and remains roughly 30 percent below the mid-2010s peak (Transnet 2025). The infrastructure backlog is enormous, the skills gaps are wide, and the competitive position has deteriorated significantly. Full recovery will take years.

### Comparative Policy Box: Ethiopia's Railway and Industrial Park Strategy

Ethiopia's approach to infrastructure development offers interesting contrasts. The Addis Ababa–Djibouti Railway, completed in 2018 with Chinese financing and construction, created a modern rail link from the landlocked Ethiopian interior to the port of Djibouti:

* **Integrated planning**: The railway was planned alongside industrial parks that would generate freight;
* **Speed of delivery**: The project was completed in approximately six years, fast by international standards;
* **Foreign partnership**: Chinese state enterprises provided financing, construction, and initial operation;
* **Technology transfer**: Ethiopian workers were trained to eventually take over operations.

The results have been mixed—the railway has faced operational challenges and lower-than-projected volumes—but the model of coordinated infrastructure and industrial development is instructive.

For South Africa, lessons include: the value of integrating transport planning with industrial strategy; the potential for strategic partnerships to accelerate delivery; and the importance of linking infrastructure investment to economic activities that will generate demand.

***

## V. Institutional Decay and State Capture

The infrastructure crises described above are symptoms of a deeper malady: the erosion of institutional capacity across much of the South African state (Chipkin and Swilling 2018). This erosion has multiple causes—skills shortages, inadequate systems, and political interference—but its most damaging manifestation was the systematic corruption known as "state capture."

### A. The Mechanics of State Capture

State capture, as documented exhaustively by the Zondo Commission (formally the Judicial Commission of Inquiry into Allegations of State Capture), refers to the period roughly from 2009 to 2018 during which criminal networks—particularly associated with the Gupta family and their allies—systematically captured and looted state institutions (Zondo Commission 2022).

The mechanisms of capture included (Zondo Commission 2022; Chipkin and Swilling 2018):

**Board and executive appointments**: Compliant individuals were installed in leadership positions at SOEs and in government departments. Those who resisted were removed, often through manufactured disciplinary processes or political pressure.

**Procurement manipulation**: Contracts were steered to favoured suppliers, often at inflated prices, with kickbacks flowing to political patrons. The 1,064 locomotives contract at Transnet is one example; coal supply contracts at Eskom are another (Zondo Commission 2022).

**Regulatory capture**: Regulators who should have provided oversight were neutralised. The Hawks (priority crimes unit) and National Prosecuting Authority were hobbled to prevent investigation and prosecution.

**Intelligence weaponisation**: Security services were used to gather information on opponents of capture and to protect those involved.

The economic costs were enormous—hundreds of billions of rand directly stolen or wasted, plus the indirect costs of institutional degradation (National Treasury 2024). But the institutional damage may be even more consequential than the financial loss (Chipkin and Swilling 2018). State capture eroded the norms, skills, and cultures that make institutions function. Even after the corrupt individuals are removed, the institutions they hollowed out do not automatically recover.

### B. Municipal Collapse

While national-level state capture dominated headlines, a quieter collapse was occurring at the local level. Municipalities—responsible for essential services including water, sanitation, roads, and refuse collection—have in many cases ceased to function effectively (Auditor-General South Africa 2023).

The statistics are alarming (Auditor-General South Africa 2023). The 2026 Budget acknowledged, with unusual directness, that 163 of 257 municipalities—63 percent—are in financial distress (National Treasury 2026). The Auditor-General's annual reports document billions of rand in irregular expenditure at municipalities—spending that did not comply with legal requirements. Fewer than one in ten municipalities receives a clean audit. Many are technically insolvent, unable to pay suppliers or service debt.

The service delivery consequences are visible across the country: potholes that go unrepaired for years; water systems that provide contaminated or no water; sewage spills into rivers and public spaces; refuse that piles uncollected. Service delivery protests—often violent—have become a regular feature of South African life, as communities express frustration at municipal failure (Statistics South Africa 2024).

Hausmann et al. (2023) characterise this dynamic as **"premature load bearing"**: municipalities were assigned significant responsibilities for electricity distribution, water and sanitation management, and road infrastructure in the decade following apartheid, in an effort to address regional inequalities. But many of these responsibilities were inconsistent with local capabilities. Maintaining water treatment works requires experienced engineers that rural municipalities cannot recruit or retain; managing electricity distribution requires commercial and billing systems that small municipalities lack. South Africa's fiscal architecture is unusual in the degree of expenditure that occurs at the local level relative to its much more limited decentralisation of taxing and borrowing powers — creating a structural mismatch between mandates and resources that goes beyond individual municipal mismanagement.

The causes of municipal collapse include (COGTA 2023):

* **Skills shortages and hiring freezes**: Many municipalities lack qualified engineers, financial managers, and technical staff. The problem extends beyond local government: the Department of Employment and Labour operates with a 34 percent vacancy rate, and DPSA Circular 49 imposed further hiring freezes across the public service (National Treasury 2026). Between 2015 and 2025, parliamentary portfolio committees issued 246 recommendations on vacancy filling—none of which was addressed by Operation Vulindlela reforms (Parliamentary Monitoring Group 2025);
* **Political appointments**: As at the national level, appointments often prioritise political loyalty over competence (Chipkin and Swilling 2018);
* **Financial stress**: Revenue bases are weak, particularly in rural and small-town municipalities (National Treasury 2026);
* **Unfunded mandates**: Municipalities are assigned responsibilities without adequate resources;
* **Corruption**: While less dramatically captured than national SOEs, many municipalities suffer from procurement fraud and theft (Auditor-General South Africa 2023).

**The Municipal Utility Death Spiral**: A particularly pernicious dynamic afflicts municipal finances through their electricity distribution function. Historically, municipalities purchased bulk electricity from Eskom at regulated prices and resold it to consumers with a markup that cross-subsidised other services (National Treasury 2011). This model is now collapsing from multiple directions.

Load shedding reduced the volume of electricity municipalities could sell while fixed costs remained. Rising Eskom tariffs—necessary for Eskom's own financial survival—squeeze municipal margins. Meanwhile, wealthier households and businesses increasingly install rooftop solar, reducing their municipal electricity purchases. This "solar exodus" erodes the revenue base while leaving municipalities serving poorer households with lower margins. The financial dimension is severe: municipal arrears to Eskom escalated from R74.4 billion to R94.6 billion in a single year (National Treasury 2026), even as Eskom itself returned to profitability. The end of load shedding, paradoxically, may accelerate the municipal revenue crisis by encouraging further rooftop solar adoption—households that invested in solar during the crisis are unlikely to revert to full grid dependence.

The municipal utility model—which once provided reliable cross-subsidisation revenue—has entered a death spiral that compounds the broader fiscal stress. Municipalities cannot easily replace this revenue; the alternatives (property rates, other tariffs) face political and economic constraints. The result is accelerated deterioration of municipal services as revenue sources collapse faster than expenditure can be adjusted (Financial and Fiscal Commission 2023).

**Political fragmentation**: The 2021 local government elections produced coalition or minority governments in many municipalities, particularly metros. Coalition instability—with governing arrangements shifting as parties realign—makes consistent policy implementation difficult. Johannesburg, Tshwane, and Ekurhuleni have experienced repeated changes in political control, disrupting planning and management continuity (IEC 2021).

### C. The Water Crisis: The Next Emergency?

Water infrastructure may represent the next major crisis (Department of Water and Sanitation 2023). South Africa is a water-scarce country; climate change is reducing rainfall in some regions; and the infrastructure for water treatment and distribution is deteriorating.

Warning signs include (Department of Water and Sanitation 2023):

* **Treatment plant failures**: Several municipalities have experienced failures of water treatment plants, resulting in untreated or inadequately treated sewage being released into water systems;
* **Non-revenue water**: Much of the water pumped into distribution systems is lost to leaks or illegal connections—in some areas, over 50 percent (COGTA 2023);
* **Dam levels**: While variable with rainfall, dam levels in some systems have reached critically low levels during droughts;
* **Bulk water constraints**: Major systems like Rand Water (serving Gauteng) face capacity constraints as demand grows (Rand Water 2024).

The scale of institutional failure is documented in the Department of Water and Sanitation's own regulatory reports. The Blue Drop assessment (drinking water quality) found that the majority of water systems fail to meet minimum standards; the Green Drop report revealed widespread collapse in wastewater treatment, with untreated or partially treated sewage discharged into rivers that serve as downstream drinking water sources—a public health risk of the first order. The No Drop assessment, focused on water conservation and demand management, found that non-revenue water—water lost to leaks, burst pipes, and illegal connections before reaching consumers—runs at approximately 41 percent nationally, with some municipalities losing over 60 percent (Department of Water and Sanitation 2023). This is not primarily a climate or scarcity problem; it is an institutional and maintenance failure. South Africa loses nearly half its treated water before it reaches a tap, even as it faces genuine physical scarcity in large parts of the country.

The risk of a "Day Zero" scenario—major urban taps running dry—is real. Cape Town came close in 2018 during severe drought (City of Cape Town 2018). Other cities could face similar stress if system-management capacity continues to decline.

**Figure 3.5** illustrates the broader pattern of declining public investment that underlies infrastructure deterioration. While Figure 1.2 presented total GFCF trends in the macro context, the pattern here underscores the infrastructure-specific consequences: public-sector capital expenditure has borne a disproportionate share of the decline, with government capital budgets consistently underspent even as allocations shrank (National Treasury 2026).

<figure><img src="/files/IAlR4YCqx0Hqk1gv9N31" alt="Line chart showing gross fixed capital formation as percentage of GDP declining from 21.6% peak in 2008 to 13.7% in 2020, with public-sector capital expenditure falling even more sharply, illustrating the infrastructure investment gap underlying deterioration in network industries"><figcaption><p><strong>Figure 3.5:</strong> Gross Fixed Capital Formation and the Infrastructure Investment Gap. <em>Source: SARB, World Bank. Note: Total GFCF declined from 21.6% of GDP at its 2008 peak to 13.7% in 2020, recovering only slightly since. Public-sector capital expenditure has fallen even more sharply as fiscal consolidation prioritised current spending over infrastructure maintenance and expansion (see also Figure 1.2 for the macro-level investment trajectory).</em></p></figcaption></figure>

**The interest rate constraint on infrastructure**: The investment collapse in Figure 3.5 reflects not only governance failure but also macroeconomic conditions discussed in Chapter 2. Persistently high real rates raise the cost of long-term project finance for both public and private infrastructure. As debt service absorbs a larger budget share, fewer projects clear financial thresholds.

Fiscal-monetary dynamics therefore compound the crisis: fiscal stress raises risk premia, higher rates raise debt service, debt service crowds out capital spending, weaker infrastructure suppresses growth, and weak growth worsens fiscal strain. Breaking this loop requires progress on both fiscal sustainability and institutional governance.

### Comparative Policy Box: Rwanda's Governance Reforms

Rwanda offers lessons in rapid institutional improvement, albeit in a very different political context. After the 1994 genocide devastated the country's institutions, Rwanda rebuilt with striking effectiveness:

* **Performance contracts (Imihigo)**: Public officials sign annual performance contracts with specific, measurable targets, publicly reviewed;
* **One-stop centres (Irembo)**: Service delivery was streamlined through physical and digital one-stop shops, reducing bureaucracy and corruption opportunities;
* **Anti-corruption**: Zero tolerance for corruption was enforced, with consequences regardless of position;
* **Technology**: Digital systems for payments, permits, and services reduced human discretion and leakage;
* **Results orientation**: Focus on measurable outcomes rather than inputs or processes.

Rwanda's success cannot be simply transplanted—its political system is authoritarian, its scale is small, and its starting point (post-genocide devastation) was unique. But specific mechanisms—performance contracts for public officials, digitisation of services, systematic anti-corruption—offer lessons that might be adapted.

For South Africa, the relevant lessons include: the importance of measurable performance targets with consequences; the value of technology in reducing corruption opportunities; and the possibility of rapid institutional improvement when there is political will.

***

## Policy Debates and Reform Frontiers

The preceding sections have documented the depth of South Africa's infrastructure crisis and the institutional decay that produced it. What is to be done? This question animates one of the most consequential policy debates in contemporary South Africa—one that cuts to the heart of what kind of state and economy the country is building. The debate is neither purely technical nor merely ideological; it is shaped by thirty years of experience with what works, what fails, and what the country can actually afford.

### The Current Debate

Four intersecting debates define the reform terrain. Each involves genuine trade-offs and real disagreements among serious analysts—not simply a contest between good policy and political obstruction.

**Private versus public infrastructure provision.** The Centre for Development and Enterprise (CDE), drawing on its extensive research programme on infrastructure and growth, has consistently argued that private sector participation is essential to closing South Africa's infrastructure gap (CDE 2022). In this view, the state has demonstrated—repeatedly and at enormous cost—that it cannot deliver infrastructure at the scale, speed, or quality required. Private capital brings not only money but discipline: the profit motive creates incentives for efficiency, cost control, and timely completion that public procurement processes systematically fail to generate. CDE's position draws empirical support from the REIPPPP experience, where competitive private procurement delivered renewable energy capacity faster and cheaper than Eskom's own new-build programme.

The Institute for Economic Justice (IEJ), by contrast, argues that the answer to state failure is not to abandon the state but to rebuild it (IEJ 2023). In this analysis, privatisation risks creating a two-tier infrastructure system: reliable services for those who can pay, continued dysfunction for the poor. The IEJ points to international evidence that private infrastructure concessions, particularly in water and electricity distribution, can entrench inequality and that regulatory capture by private firms is at least as dangerous as political capture of public ones. Their preferred approach is to rebuild public sector capacity—through professionalisation, competitive remuneration, and institutional reform—rather than to outsource state functions permanently.

There is something to each position, and a sensible policy probably draws on both. The electricity sector's experience suggests that private participation in generation works well under competitive procurement, while transmission and system operation may require continued public ownership with strong governance. In practice, the answer varies by sector, by function, and by conditions on the ground.

**Municipal collapse: triage or comprehensive rebuilding?** Section V documented the dimensions of municipal failure; the debate here concerns the remedy. South Africa has 257 municipalities, and their performance ranges from competent to catastrophic—with 163 in financial distress (National Treasury 2026). The South African Local Government Association (SALGA) has advocated for comprehensive support programmes that address capacity deficits across all struggling municipalities through training, shared services, and peer learning (SALGA 2023). National Treasury's municipal support programmes—including the Municipal Finance Improvement Programme and the Infrastructure Delivery Management System—take a similar approach, emphasising financial management, planning capacity, and technical assistance (National Treasury 2024).

Critics argue that this "water the whole garden" approach spreads limited resources too thin. When a municipality is truly collapsed—unable to produce financial statements, provide clean water, or retain qualified staff—incremental capacity building is futile. What is needed, in this view, is a triage approach: concentrate resources on municipalities that can be saved, place the most dysfunctional under direct national or provincial administration, and accept that some will need to be amalgamated or restructured entirely (COGTA 2023). The constitutional framework complicates this—Section 139 interventions allow provincial or national takeover of failing municipalities, but the procedures are cumbersome, politically fraught, and have a poor track record of producing lasting improvement (Financial and Fiscal Commission 2023).

The 2026 Budget signalled a significant rhetorical and policy shift on this question—from "oversight" to what Treasury described as "active structural intervention" (National Treasury 2026). Concrete steps include R27.7 billion in performance-based grants for metropolitan utilities and R19.2 billion shifted to an urban development financing grant covering water, sanitation, electricity, and waste. Operation Vulindlela Phase II now includes local government reform and municipal service delivery improvements. Whether this represents a genuine pivot to the triage approach—with performance conditions that amount to real consequences for failure—or merely a repackaging of the comprehensive approach remains to be seen.

**SOE governance models.** The governance debate ranges across a broad spectrum. At one end, advocates of full privatisation argue that state ownership is inherently prone to political interference and that selling SOEs to private operators—with appropriate regulation—would improve performance and release fiscal resources (CDE 2022). At the other, defenders of state ownership argue that network industries are natural monopolies where private ownership creates rent extraction rather than efficiency gains (IEJ 2023).

Between these poles lie several intermediate options. "Corporatisation"—the current model—retains state ownership but operates SOEs under company law with commercial mandates. Its failures are well documented in this chapter. The "hybrid" model combines public ownership with private participation: the state retains the asset base while contracting operations to private firms, as in the Durban port terminal concession. This model is gaining ground in both energy and logistics (The Presidency 2020-2024). A more radical option is the statutory board model, discussed below, which insulates operational management from political cycles through independent governance structures with fixed terms and professional appointment criteria.

**Operation Vulindlela: scope and limitations.** Operation Vulindlela (OV), the joint initiative of the Presidency and National Treasury launched in 2020, is arguably the most significant structural reform effort since the transition (The Presidency 2020-2024). Its achievements are real: the liberalisation of embedded electricity generation, the opening of rail to third-party access, spectrum allocation after years of delay, and progress on water-use licensing reform. The OV model—a small, technically capable team embedded at the centre of government, with presidential backing—has shown that targeted reform is possible even within a constrained institutional environment.

But OV's limitations are equally instructive. It works best on reforms that require changing regulations or removing bureaucratic bottlenecks—problems of rules rather than capacity. It is less effective where the constraint is implementation rather than policy design: a municipality does not begin functioning because Pretoria issues a new framework. OV also depends heavily on political support at the highest level, making it vulnerable to changes in leadership priorities. And its small team cannot simultaneously drive reform across every dysfunctional institution. OV's Phase II expansion into local government, water, and digital infrastructure tests whether the model can scale beyond its initial successes.

The 2026 Budget introduced a complementary set of governance reforms aimed at addressing the implementation gap that OV cannot reach (National Treasury 2026). The Targeted and Responsible Savings (TARS) programme reallocated R12 billion from wasteful activities—a shift from simply cutting budgets to redirecting funds based on performance assessment. A ghost worker audit flagged 4,323 high-risk payroll fraud cases. Social grant compliance checks identified 291,581 questionable beneficiaries and cancelled 34,661 grants, saving R170.7 million. These are tactical rather than structural reforms, but they represent the kind of administrative housekeeping that the BRRR recommendation data has demanded for a decade.

### International Lessons

South Africa is not the only middle-income country wrestling with infrastructure deficits and institutional constraints. Three international experiences offer specific, transferable lessons—though none can be transplanted wholesale into a context shaped by South Africa's particular history and political economy.

**Chile's infrastructure concession model.** Chile pioneered the use of public-private partnerships (PPPs)—contractual arrangements in which private firms finance, build, and operate infrastructure assets for a fixed period before transferring them back to the state—for infrastructure delivery in Latin America during the 1990s (Engel, Fischer, and Galetovic 2014). The concession model delivered major highways, airports, and port facilities at a pace that public procurement could not have matched. Two features distinguished Chile's approach from less successful PPP programmes elsewhere. First, regulatory oversight was strong: an independent concessions authority set standards, monitored performance, and enforced contractual obligations. Second, risk allocation was explicit and realistic—rather than governments absorbing all downside risk while private firms captured upside returns, Chilean concession contracts distributed risks to the party best placed to manage them.

The model was not without problems. Early contracts underestimated demand, leading to windfall profits for some concessionaires and political backlash. Renegotiation of contracts became common, raising concerns about the integrity of the competitive process (Guasch 2004). And the model worked best for user-fee-financed infrastructure (toll roads, airports) rather than for assets serving populations unable to pay.

For South Africa, Chile's experience suggests that PPPs can work—but only with regulatory capacity that South Africa currently lacks. Importing the concession model without building the regulatory infrastructure to oversee it risks repeating the problems of the arms deal and the locomotive procurement: contracts that enrich private parties at public expense. The lesson is that private participation requires *more* state capability in regulation, not less.

**Colombia's 4G road programme.** Colombia's "fourth generation" (4G) road programme, launched in 2013, addressed a chronic infrastructure deficit through an innovative risk-sharing framework for highway construction (Fainboim and Rodriguez 2018). The programme's design reflected hard lessons from three previous generations of road concessions that suffered from cost overruns, construction delays, and contractual disputes. The 4G framework introduced several innovations: standardised contracts that reduced transaction costs; a national infrastructure agency (ANI) with genuine technical capacity; independent risk assessment for each project; and contingent liability management through the national government's fiscal framework.

The results were substantial—approximately 8,000 kilometres of highway construction and improvement were contracted, with substantially better on-time and on-budget performance than previous programmes (DNP Colombia 2020). The programme attracted international institutional investors, demonstrating that well-structured infrastructure projects in emerging markets could meet the risk-return requirements of pension funds and sovereign wealth funds.

What matters for South Africa is the risk-sharing mechanism. South African PPPs have historically foundered on risk allocation—either the government absorbs too much risk (making the "private" participation largely fictional) or contracts impose unrealistic risks on private parties (deterring participation). Colombia's experience shows that getting risk allocation right is technically demanding but achievable, and that it requires a dedicated institution with the expertise to structure complex deals. South Africa's existing PPP unit within National Treasury has been understaffed and underutilised; scaling it up—with lessons from Colombia's ANI—could unlock significant infrastructure investment (National Treasury 2024).

**Rwanda's iRembo digital government platform.** Rwanda's iRembo platform, discussed briefly in the comparative box above, merits further analysis as a case of state capacity leapfrogging—bypassing stages of institutional development through technology adoption. Launched in 2014 as a public-private partnership between the Rwandan government and a local technology firm, iRembo digitised over 100 government services, from birth registration to business licensing (Government of Rwanda 2023). The platform reduced processing times from weeks to minutes, virtually eliminated petty corruption in service delivery (by removing human discretion from routine transactions), and generated data that enabled performance monitoring in real time.

The transferability question is worth pausing on. Rwanda's success with iRembo rested on several factors absent or weaker in South Africa: a small, centralised state with strong top-down authority; a population accustomed to rapid institutional change; limited legacy IT systems to integrate with; and a government willing to grant genuine operational autonomy to the implementing partner. South Africa's larger scale, federal structure, powerful unions resistant to automation, and complex legacy systems present different challenges. Still, the core lesson—that digital platforms can reduce corruption, speed up service delivery, and generate accountability data—applies broadly. South Africa's own experiments with digital government—e-filing for taxes, the Home Affairs modernisation programme—show that technology-enabled improvement is possible. The difficulty is extending these islands of digital competence to the broader public service, especially at the municipal level (DPSA 2023).

### Reform Tiers: Achievable and Transformative

It helps to distinguish between reforms that are achievable under current institutional and fiscal constraints and those that would require more fundamental institutional change. This distinction serves as a pedagogical device—a way of thinking about feasibility and sequencing—rather than as advocacy for any particular programme. The boundary between the two tiers is not fixed. South Africa's own history shows how ideas can migrate from "impossible" to "inevitable" with startling speed: the negotiated transition, the opening of electricity generation to private producers, and the liberalisation of spectrum allocation were all, at various points, considered politically unthinkable.

**Tier 1 — The Achievable Agenda.** These reforms are feasible under current fiscal constraints and within existing constitutional and institutional arrangements. They require political will and technical capacity but not fundamental structural change.

*Accelerate the PPP framework for infrastructure.* South Africa's existing PPP regulations, housed in National Treasury Regulation 16, are widely regarded as cumbersome and slow (National Treasury 2024). Projects take years to reach financial close, deterring private participation. Streamlining the approval process—while maintaining fiscal safeguards against excessive contingent liabilities—would enable faster project preparation and execution. The Infrastructure Fund, established in 2020 to blend public and private finance for infrastructure, provides an institutional vehicle; what it lacks is a pipeline of bankable projects that the current PPP framework is too slow to produce.

*District development model for failing municipalities.* The District Development Model (DDM), introduced in 2019, coordinates planning and service delivery across the 44 district municipalities and 8 metropolitan areas (COGTA 2023). In principle, it allows national and provincial government to concentrate resources where municipal capacity is weakest—directing engineers, financial managers, and project managers to districts where local capacity has collapsed. The DDM's implementation has been uneven, but its logic is sound: pooling scarce technical capacity at the district level, rather than expecting each of 257 municipalities to maintain full professional capacity independently. Making the DDM operational requires moving beyond planning documents to actual deployment of people and resources. Critics have noted, however, that the DDM risks adding a fourth layer of bureaucracy—alongside national, provincial, and local government—without addressing the underlying inability to remove incompetent municipal officials or enforce consequences for non-performance. Coordination is valuable only if the entities being coordinated have the capacity to act on coordinated plans.

*Operation Vulindlela Phase II institutional reforms.* OV's second phase extends the reform programme to water licensing, digital infrastructure (including broadband and data policy), and local government support (The Presidency 2024). These reforms follow OV's established playbook: identify specific regulatory or administrative bottlenecks, develop technically sound solutions, and use presidential authority to overcome bureaucratic resistance. Whether the model scales remains to be seen, but the institutional infrastructure—the team, the methodology, the political backing—already exists.

*Eskom unbundling completion and competitive electricity market.* The formal separation of Eskom into Generation, Transmission (NTCSA), and Distribution entities is underway but incomplete (Eskom 2024). The end of load shedding and Eskom's return to profitability have reduced the political urgency of reform, but completing the unbundling—establishing NTCSA as a genuinely independent system operator, creating a transparent market for electricity trading, and enabling competition among generators—remains essential to entrench the gains from embedded generation liberalisation and create institutional conditions for sustained private investment. The risk is that crisis resolution breeds complacency: the structural vulnerabilities that produced load shedding have been managed, not eliminated, and only a competitive market structure can prevent their recurrence.

**Tier 2 — The Transformative Agenda.** These reforms would require constitutional amendment, fundamental institutional restructuring, or political consensus that does not currently exist. They are not utopian—each has precedent in comparable countries—but they demand a level of institutional change that goes beyond the current reform programme.

*Constitutional amendment for direct national intervention in collapsed municipalities.* The current Section 139 framework for intervening in dysfunctional municipalities is procedurally complex, politically contested, and has rarely produced sustained improvement (Financial and Fiscal Commission 2023). A more decisive mechanism—allowing national government to dissolve a municipality's political structures and appoint administrators with full executive authority for a defined period—would require amending the constitutional provisions that protect municipal autonomy. The political difficulty is plain enough: the ANC and other parties derive local power from municipal structures and would resist reducing that power. But the human cost of allowing collapsed municipalities to keep failing their residents indefinitely is also a political fact.

*Singapore-style statutory board model for SOEs.* Singapore's statutory boards—including the Housing and Development Board, the Port of Singapore Authority (now PSA International), and the Public Utilities Board—operate as autonomous public entities with professional management, fixed-term appointments, and insulation from day-to-day political interference (Lee 2000). Board members are appointed on merit through transparent processes; performance is measured against published targets; and operational autonomy is balanced by accountability to Parliament through annual reporting and audit. Adapting this model for South Africa's major SOEs would require legislation establishing genuinely independent governance structures—not merely reshuffling board members, which has been tried repeatedly without lasting effect, but creating legal frameworks that make political interference in operational decisions procedurally difficult and personally costly for those who attempt it.

*Mandatory infrastructure maintenance funding through hypothecated taxation.* A hypothecated tax is one whose revenue is earmarked for a specific purpose rather than flowing into the general fiscus. The chronic underfunding of infrastructure maintenance—documented throughout this chapter—suggests that discretionary budget allocation is structurally inadequate: when budgets are tight, maintenance is the first item cut because its consequences are deferred rather than immediate. A dedicated infrastructure maintenance levy—perhaps a surcharge on fuel, electricity, or property—with revenues ring-fenced for maintenance of existing infrastructure assets, would provide predictable funding and make the cost of maintenance visible to taxpayers (National Treasury 2024). South Africa already has precedent in the Road Accident Fund levy on fuel; extending the principle to infrastructure maintenance would be administratively feasible but politically challenging, given public resistance to additional taxation in a weak economy.

*Complete overhaul of the intergovernmental fiscal framework.* The fiscal framework governing transfers between national, provincial, and local government—the equitable share formula, conditional grants, and own-revenue arrangements—was designed in the late 1990s and has been incrementally adjusted since (Financial and Fiscal Commission 2023). Its basic architecture, however, has not kept pace with changed circumstances: the collapse of municipal electricity revenue (as wealthier customers exit the grid), the growing mismatch between assigned functions and available resources, and the extreme variation in municipal capacity. A comprehensive overhaul—reconsidering which functions sit at which level of government, redesigning transfer mechanisms, and potentially redrawing municipal boundaries to create more viable units—would address root causes rather than symptoms. The Division of Revenue Act process provides a mechanism for incremental adjustment, but the scale of dysfunction may require more fundamental rethinking (FFC 2023).

### Evidence from Parliamentary Oversight

The gap between identifying infrastructure problems and actually solving them shows up clearly in data from South Africa's parliamentary oversight system. An analysis of Budgetary Review and Recommendation Reports (BRRRs)—the reports through which parliamentary portfolio committees assess departmental and SOE performance and make recommendations to the executive—reveals a striking pattern of institutional futility.

Between 2015 and 2025, parliamentary portfolio committees issued 5,256 individual recommendations across the departments and entities relevant to infrastructure and state capacity (Parliamentary Monitoring Group 2025). The thematic distribution tells its own story: compliance and reporting requirements dominated with 857 recommendations, followed by budget execution and financial management with 616 recommendations. Governance and accountability, human resources and skills, and service delivery improvement each generated hundreds of additional recommendations.

Many of these recommendations are substantive and technically sound—parliamentary committees, supported by research staff and informed by the Auditor-General's findings, regularly identify the precise problems documented in this chapter: maintenance backlogs, skills shortages, procurement irregularities, and governance failures. The difficulty is not diagnosis but remedy. The same issues recur year after year because the BRRR process is, by design, advisory: committees can recommend but cannot compel (Parliament of the Republic of South Africa 2019). A portfolio committee can recommend that Eskom improve its maintenance programme, but it cannot force Eskom to hire the engineers, allocate the budget, or change the procurement processes necessary to do so.

This creates what might be called a "recommendation trap"—a cycle in which oversight bodies identify problems with increasing precision, generate recommendations with increasing urgency, and observe the same problems recurring with depressing regularity. The trap is not unique to South Africa; legislatures in many democracies struggle to translate oversight findings into executive action (Pelizzo and Stapenhurst 2012). But the South African case is especially acute because the problems are so severe and the recommendations so consistently ignored.

A useful distinction emerges from the BRRR data between what might be called the "hardware" and "software" of state capacity. The hardware—energy infrastructure, logistics networks, water systems, physical capital—is where the 2026 Budget and Operation Vulindlela have made their most visible progress: the R1.07 trillion infrastructure pipeline, the end of load shedding, the energy and logistics reforms. The software—procurement systems, consequence management, vacancy filling, institutional culture, and administrative competence—is where progress remains stubbornly inadequate. Software themes generate approximately 40 percent of all BRRR recommendations. Four critical areas—procurement reform (248 recommendations), irregular expenditure (221 recommendations), consequence management (156 recommendations), and vacancy filling (246 recommendations)—have received zero Operation Vulindlela reforms despite a decade of parliamentary attention (Parliamentary Monitoring Group 2025). The 2026 Budget's R1.07 trillion infrastructure pipeline is impressive only if the procurement and implementation capacity to execute it has improved—and the BRRR record suggests it has not.

The primary legislative response to the procurement deficit is the Public Procurement Act of 2024, which consolidates and standardises public procurement rules—previously scattered across multiple statutes and departmental regulations—under a single Public Procurement Office housed in National Treasury. The Act establishes "value for money" as the overarching procurement principle and creates uniform processes for tender evaluation, supplier debarment, and contract management. Yet it also embeds a tension that the BRRR recommendations cannot resolve: the Act must simultaneously advance "preferential procurement" goals—reserving a share of contracts for designated groups as a transformation instrument—and enforce cost-effectiveness. Whether a single legislative framework can serve both objectives without creating the kind of discretionary ambiguity that enabled procurement abuse in the first place remains to be seen.

Analysis of the BRRR recommendations estimates the full implementation cost at approximately R475 billion over five years (Wilse-Samson 2026)—a sum that is modest when set against the recurring, economy-wide costs of institutional failure documented throughout this chapter. Of the 5,256 recommendations, approximately 441 were classified as "quick wins"—high impact, high feasibility, low cost reforms that require no additional funding, only administrative and regulatory action. The fiscal space created by the 2025-2026 turning point—primary surpluses, declining debt trajectory—makes these reforms more feasible, not less.

This reinforces the distinction between the two reform tiers. Tier 1 reforms work within existing oversight and accountability structures, accepting their limitations—and are where quick wins can be captured. Tier 2 reforms would restructure the very mechanisms that have failed—giving Parliament enforcement powers, creating independent implementation bodies, or establishing automatic consequences for non-compliance. Without addressing the software deficit, even substantial hardware investment risks the same leakage and underperformance that generated 248 procurement recommendations over the past decade. The choice between tiers is ultimately political, but it ought to be made consciously rather than by default.

***

## VI. Conclusion: Rebuilding Capacity

This chapter has documented how state institutions—especially those responsible for network infrastructure—deteriorated to the point of becoming a binding constraint on development, and has surveyed the contested debates over how to rebuild them (National Planning Commission 2012; World Bank 2018). For years, electricity losses were measured in multiple GDP points annually (CSIR 2024), logistics failures eroded export competitiveness (World Bank 2023), and municipal collapse threatened basic services (Auditor-General South Africa 2023). In key domains, the developmental state became an obstacle to transformation.

The picture in 2025-2026, however, is more nuanced than at any point in the preceding decade. The end of load shedding—after 200 consecutive days without cuts—and Eskom's return to profitability demonstrate that infrastructure crises, even deeply entrenched ones, can be resolved when reforms are implemented with consistency. The combination of Eskom unbundling, private generation liberalisation, improved maintenance, and the renewable-investment surge delivered a result that seemed impossible during the darkest days of 2022-2023. Capture networks have been disrupted, though accountability remains incomplete. Operation Vulindlela has shown that targeted coordination can deliver (The Presidency 2020-2024).

Yet serious risks remain. Eskom's ageing coal fleet will require continued heavy maintenance and eventual replacement. Municipal infrastructure continues to deteriorate, with arrears to Eskom reaching R94.6 billion. Transnet's operational and financial recovery has been slower than Eskom's. Water infrastructure—a crisis still largely invisible to the national debate—poses risks that may rival electricity in the coming decade. The infrastructure constraint has eased but not been eliminated.

Several themes emerge from this analysis:

**The primacy of institutions**: Infrastructure is not only physical assets; it depends on institutions that plan, build, maintain, and operate those assets (Evans 1995). South Africa's infrastructure crisis is therefore fundamentally institutional.

**The costs of capture**: State capture was not only theft but institutional destruction (Chipkin and Swilling 2018). Lost money mattered, but erosion of skills, norms, and systems was deeper and longer-lasting.

**The limits of state monopoly**: Failures at Eskom and Transnet show that network-industry monopolies are vulnerable to capture and decay (OECD 2015). Competition, private participation, and effective regulation can provide missing checks.

**The importance of maintenance**: New builds attract attention, but routine maintenance determines actual service reliability. A substantial part of South Africa's infrastructure crisis is a maintenance crisis.

The policy debates surveyed in the preceding section translate these themes into choices. On private versus public provision, the electricity experience points to a pragmatic settlement rather than an ideological victory: competitive private participation where markets can discipline performance—most clearly in generation—combined with rebuilt public capability in transmission, system operation, and regulation, where independent, adequately resourced regulators (NERSA for energy, the planned Transport Economic Regulator for logistics) become more important, not less, as markets open. On municipal collapse, the 2026 Budget's turn towards performance-based intervention suggests the beginnings of triage, but the deeper choice between comprehensive support and concentrated rescue remains unresolved. On SOE governance, the lesson of repeated board reshuffles is that only structural insulation from political interference—completed unbundling, statutory-board models, genuine consequences for failure—will endure. And the parliamentary oversight record issues the sharpest warning: the "software" of state capacity—procurement, consequence management, vacancy filling, skills and professionalisation—has absorbed a decade of recommendations without reform, and no infrastructure pipeline, however large, can outrun broken implementation systems.

The stakes are high. Infrastructure that works is a precondition for almost everything else—for manufacturing, for agriculture, for services, for employment, for the basic quality of life of citizens. Whether South Africa's development prospects improve depends on extending the reform momentum of 2024-2026 from the visible hardware of megawatts and freight volumes to the quieter software of a capable state.

### Binding Constraints Connection

Three of the six binding constraints—the **energy crisis**, **logistics breakdown**, and **state capacity erosion**—are the direct subject of this chapter. Their consequences cascade through every chapter that follows. Unreliable electricity raises costs for agriculture (Chapter 4), reduces mining output (Chapter 5), closes manufacturing firms (Chapter 6), disrupts services and tourism (Chapter 7), and destroys jobs (Chapter 8). The logistics breakdown at Transnet constrains agricultural exports (Chapter 4), prevents mining companies from moving product to port (Chapter 5), and raises input costs for manufacturers (Chapter 6). State capacity failures at municipalities undermine education delivery (Chapter 9) and social grant administration (Chapter 10). The **investment collapse** is partly a consequence of these infrastructure failures: firms will not invest where power is unreliable and logistics are broken. And **human capital deficits** are compounded when schools lack electricity, water, or functioning infrastructure. The infrastructure and state capacity constraints documented here are thus the transmission mechanism through which institutional failure reaches every sector and every household.

{% hint style="success" %}
**Key Takeaways**

1. State capability has become the binding constraint on South Africa's development—macroeconomic stability and sectoral policies cannot succeed when basic infrastructure is unreliable and institutions are dysfunctional.
2. The electricity crisis, rooted in delayed investment decisions (1990s-2000s) and compounded by state capture corruption at Eskom, reduced the Energy Availability Factor from around 90% to 53%, costing the economy an estimated 2–5% of GDP annually at its peak (National Treasury 2024). The crisis was resolved by mid-2025 through a combination of improved maintenance, market liberalisation, and the private generation surge—demonstrating that even deeply entrenched infrastructure failures can be addressed.
3. Transnet's rail and port failures—including the corrupt locomotive procurement and operational collapse—have shifted freight to roads, increased export costs, and earned Durban port a ranking of 398th out of 405 globally.
4. State capture (2009-2018) was not merely theft but institutional destruction: the erosion of skills, norms, and systems that make institutions function, requiring years of rebuilding rather than simple personnel changes.
5. Reforms have delivered tangible results: the opening of electricity generation to private producers (6,000+ MW of private investment), Eskom unbundling, and improved maintenance ended load shedding by mid-2025. Eskom posted its first profit since 2016/17 and reduced its debt by R39.5 billion. Third-party rail access and port concessions represent further progress, though Transnet's recovery lags behind Eskom's. Over R1 trillion in public-sector infrastructure investment is planned over the medium term (National Treasury 2026).
   {% endhint %}

## Discussion Questions

1. The concept of a "developmental state" assumes that the state has the capacity to lead development effectively. Given the evidence presented in this chapter, is the developmental state model viable for South Africa? What alternatives might be considered?
2. Eskom's crisis reflects both historical underinvestment and subsequent mismanagement. How should responsibility be allocated between the decision-makers of the 1990s-2000s (who delayed new generation) and those of the 2010s (who presided over state capture)?
3. The opening of electricity generation to private producers has been South Africa's most successful recent infrastructure reform. What lessons from this experience might apply to other network industries (rail, ports, water)?
4. State capture affected SOEs across the economy, but not all equally. What factors might explain why some institutions were more vulnerable to capture than others?
5. Municipal collapse is often attributed to skills shortages and corruption. But well-functioning municipalities exist alongside failing ones. What distinguishes the successful cases, and how might their practices be spread?

**Exercises**

1. **Load shedding cost calculation**: In 2023, Eskom shed approximately 16,000 GWh of electricity. If the average industrial electricity price is R1.50/kWh and the economic multiplier of electricity is approximately 10 (i.e., each R1 of electricity not supplied reduces GDP by approximately R10), estimate the total GDP cost of load shedding in 2023. Express this as a percentage of GDP (R7.2 trillion). How does your estimate compare to the 2-5% range cited in the chapter?
2. **Public investment multiplier**: South Africa's gross fixed capital formation fell from 21.6% to approximately 15% of GDP between 2008 and 2023. Assume the fiscal multiplier for infrastructure investment is 1.5 (i.e., each R1 of public infrastructure spending generates R1.50 of GDP). If government increased infrastructure spending by 2 percentage points of GDP, calculate (a) the additional annual investment in rand terms, (b) the expected GDP impact, and (c) the additional tax revenue generated (assuming a tax-to-GDP ratio of 25%). Would the investment partially pay for itself?
3. **Eskom unbundling analysis**: Using Figure 3.2, calculate the total generation capacity "lost" due to the EAF decline from around 90% to 53%. If Eskom's nominal installed capacity is approximately 46,000 MW, what is the effective available capacity at each EAF level? Given that new renewable energy capacity costs approximately R15 million per MW (including storage), estimate the total investment required to replace the lost capacity. Compare this to the JETP commitment of $8.5 billion (approximately R160 billion).
4. **Transnet freight diversion**: Using Figure 3.4, estimate the volume of freight (in million tonnes) diverted from rail to road between the mid-2010s peak and 2023. If road transport costs approximately R1.50 per tonne-km and rail costs R0.50 per tonne-km, and the average transport distance is 500 km, calculate the additional logistics cost imposed on the economy by this modal shift. What percentage of mining sector GDP does this represent?

***

## VII. Key Data Visualisations

This chapter incorporates five data visualisations:

1. **Figure 3.1:** Provincial GDP shares and trends — Context for spatial distribution of economic activity.
2. **Figure 3.2:** Eskom Energy Availability Factor (2000-2024) — Documents the collapse from around 90% to 53%, representing the loss of over 40% of generation capacity.
3. **Figure 3.3:** Load Shedding Intensity (GWh shed per year) — Shows the escalation of the crisis, with 2023 representing the worst year on record.
4. **Figure 3.4:** Transnet Rail Freight Volumes — Illustrates the roughly one-third decline from the mid-2010s peak, with coal and general freight most affected, and the beginnings of recovery.
5. **Figure 3.5:** Gross Fixed Capital Formation and the Infrastructure Investment Gap (% of GDP) — Shows the investment collapse from 21.6% (2008) to 13.7% (2020), with public-sector capital expenditure declining disproportionately (see also Figure 1.2).

***

## VIII. Further Reading

**Official Sources:**

* Eskom, *Integrated Report* and *System Status Reports* (annual/periodic) — Primary source on electricity system performance.
* Operation Vulindlela, *Progress Reports* (ongoing) — Official updates on structural reform implementation.
* Transnet, *Integrated Report* (annual) — Data on freight volumes and financial performance.
* Zondo Commission, *Reports of the Judicial Commission of Inquiry into Allegations of State Capture* (2022) — Comprehensive documentation of state capture across SOEs and government.

**Academic Analysis:**

* Haroon Bhorat and Timothy Kohler, "Watts Happening to Work? The Labour Market Effects of South Africa's Electricity Crisis," DPRU Working Paper 202401 (2024) — Rigorous evidence on load shedding's employment impact.
* H.R. Bohlmann, J.M. Horridge, R. Inglesi-Lotz, E.L. Roos, and L. Stander, "Regional Economic Effects of Changes in South Africa's Electricity Generation Mix," ERSA Working Paper 756 (2019) — CGE analysis of the coal-to-renewables transition and its regional impacts.
* Joshua Budlender, "Surviving in the Dark: The Mortality Effects of Reducing Rolling Blackouts," UNU-WIDER Working Paper 2024/44 (2024) — First causal evidence that load shedding increases mortality, using Cape Town's mitigation policy.
* Ivor Chipkin and Mark Swilling, *Shadow State: The Politics of State Capture* (2018) — Analysis of state capture networks and mechanisms.
* National Treasury and the Presidency, *Operation Vulindlela Phase II* (2025) — Expanded reform programme covering electricity, freight logistics, water, digital infrastructure, and local government.

**Energy Transition and Just Transition:**

* Gaylor Montmasson-Clair, "A Policy Toolbox for Just Transitions," TIPS Working Paper (2021) — Unpacks procedural, distributive, and restorative justice dimensions of the transition.
* Gaylor Montmasson-Clair, "Policy Primers for a South African Just Transition Framework," TIPS/Presidential Climate Commission (2022) — Policy foundations for the PCC's official just transition framework.
* Gaylor Montmasson-Clair, "A Tale of Three Transitions: The Pursuit of Just Transitions in South Africa," TIPS Policy Brief (2024) — Framework distinguishing the electricity, coal, and economy-wide climate transitions.
* Harald Winkler, *Energy Policies for Sustainable Development in South Africa* (2007) and subsequent work — Political economy of the energy transition, including carbon tax design (Winkler et al. 2011) and why concentrated losses in coal communities generate opposition that diffuse climate benefits struggle to overcome (Winkler 2017).

**Comparative Perspectives:**

* CSIR, *Statistics of Utility-Scale Power Generation in South Africa* (annual) — Technical analysis of electricity system.
* IMF, various country reports on SOE reform and infrastructure investment.
* World Bank, *Container Port Performance Index* (annual) — Global benchmarking of port efficiency.

***

◀️ [Chapter 2: The Macroeconomic Framework](/textbooks/the-south-african-economy/part-i-foundations/chapter-2.md)[Chapter 4: Agriculture, Land, and Food Security](/textbooks/the-south-african-economy/part-ii-sectors/chapter-4.md) ▶️