> For the complete documentation index, see [llms.txt](https://laurence-wilse-samson.gitbook.io/textbooks/llms.txt). Markdown versions of documentation pages are available by appending `.md` to page URLs; this page is available as [Markdown](https://laurence-wilse-samson.gitbook.io/textbooks/the-south-african-economy/part-ii-sectors/chapter-5.md).

# Chapter 5: Mining and the Minerals-Energy Complex

{% hint style="info" %}
**Part II: Sectors**—This chapter continues Part II's examination of South Africa's productive sectors. Chapter 4 analysed agriculture's dualism and land reform challenges. Here we turn to mining—the sector that historically defined South Africa's economic structure through the Minerals-Energy Complex—before proceeding to manufacturing (Chapter 6) and services (Chapter 7).
{% endhint %}

## Learning Objectives

By the end of this chapter, you should be able to:

1. **Explain** the historical development and contemporary significance of the Minerals-Energy Complex (MEC) in shaping South Africa's industrial structure
2. **Analyse** the performance trajectory of key mineral commodities and their contribution to GDP, exports, and employment
3. **Critically assess** beneficiation as a development strategy, considering job intensity, comparative advantage, and alternative paths including services and human capital
4. **Assess** the environmental and social costs of mining, including acid mine drainage, migrant labour systems, and informal mining
5. **Discuss** the challenges and opportunities of the just transition in coal-dependent regions

***

## I. Introduction: Mining and the Structure of the Economy

No sector has shaped South Africa's economic development more than mining (Feinstein 2005). Diamond and gold discoveries transformed a peripheral agrarian economy into Africa's industrial core (Meredith 2007). Mining financed railways, accelerated urbanisation, and helped create the migrant labour system central to apartheid political economy (Lipton 1986). The sector remains significant for GDP, exports, and jobs, but faces structural headwinds that raise questions about its future.

Mining's current contribution remains substantial but well below historical dominance (Statistics South Africa 2023). The sector now contributes roughly 6 percent of GDP and employs approximately 475,000 workers (2024), down from a peak of around 760,000 in the late 1980s (Minerals Council South Africa 2023).

> **40% of exports from 6% of GDP** — Mining's weight in trade, taxation, and total employment far outstrips its output share, which is why its fortunes still move the whole economy.

Including indirect and induced employment through supplier industries and consumption multipliers, the sector supports a considerably larger number of jobs—industry estimates run to well over a million, though such multiplier-based figures should be treated with caution. Mining generates over 40 percent of merchandise exports and provides significant government revenue primarily through corporate income tax and mineral royalties levied under the Mineral and Petroleum Resources Royalty Act (2008), supplemented by dividend withholding tax on mining company distributions. The state's direct ownership interests in mining are limited: indirect holdings through the Industrial Development Corporation (IDC) and Public Investment Corporation (PIC), and the small-scale operations of the African Exploration Mining and Finance Corporation (AEMFC), a state-owned entity that has struggled to achieve commercial viability.

These headline figures mask deep transition. Gold output has fallen by over 90 percent since its 1970 peak, pushing South Africa from global leader to outside the top ten (DMRE 2023). PGMs now dominate, supported by autocatalyst demand and possible hydrogen applications (IEA 2023). Coal, once central to the minerals-energy complex, faces structural decline as decarbonisation accelerates and domestic generation shifts.

Understanding contemporary mining requires the Minerals-Energy Complex (MEC) concept developed by Fine and Rustomjee (1996). The MEC describes the entrenched linkage between mining, cheap coal-based power, and heavy industry that emerged from deep-level gold extraction. Energy-intensive mining generated strong demand for low-cost electricity, supplied by Eskom, which in turn subsidised energy-intensive processing sectors such as steel, chemicals, and smelting (Fine 1994).

The MEC helps explain South Africa's capital intensity, concentrated ownership, weak employment absorption, and difficulty diversifying into labour-intensive manufacturing (Fine and Rustomjee 1996; Kaplan 2004). It is central to understanding the limits of beneficiation policy, the disruption of the energy transition, and adjustment pressures in mining communities.

This chapter examines mining's evolving role in the economy. It traces MEC development and post-apartheid reform through B-BBEE and the Mining Charter, analyses key mineral performance and commodity cycles, evaluates why beneficiation has delivered limited results, and reviews mining's environmental and social costs. It closes with the just-transition challenge: managing coal decline while capturing opportunities in green minerals.

***

## II. The Rise and Evolution of the Minerals-Energy Complex

### Historical Origins: Gold, Coal, and Cheap Labour

The MEC emerged from the specific technical requirements of deep-level gold mining (Fine and Rustomjee 1996). Unlike the alluvial gold deposits of California or Australia, the Witwatersrand gold reef tilted downward, requiring ever-deeper mining as surface deposits were exhausted (Meredith 2007). By the early twentieth century, mines were already operating at depths that required substantial capital investment, sophisticated engineering, and—crucially—enormous quantities of energy and labour (Feinstein 2005).

Deep-level mining had extreme energy demands. Ventilation cooled shafts above 40°C, pumps removed vast water volumes, and hoists lifted ore from ever-greater depths—depths that would eventually approach 4,000 metres in the deepest modern mines (Minerals Council South Africa 2023). This created structural demand for cheap coal-fired electricity. Escom's establishment in 1923, authorised by the Electricity Act of 1922, institutionalised that arrangement and cross-subsidised industrial development. **Figure 5.1** shows the supply side of that dependence a century later: electricity available for distribution peaked around 2007–2008 and has since fallen back towards early-2000s levels, and when supply collapsed during the load-shedding years, mining production—among the most electricity-intensive activities in the economy—fell with it (see Chapter 3).

<figure><img src="https://1783163384-files.gitbook.io/~/files/v0/b/gitbook-x-prod.appspot.com/o/spaces%2FL8lYh8bJlWCut8kRKSUq%2Fuploads%2Fgit-blob-e0aed79b041d3cd5f4234c96575988cb82184176%2Ffig_5_1_electricity_available_production.png?alt=media" alt="Two-panel line chart of monthly Stats SA electricity data from 2000 to 2025. The upper panel plots electricity available for distribution in thousands of gigawatt-hours, seasonally adjusted: it rises from about 16,000 GWh a month in 2000 to peaks above 20,000 GWh around 2007-2008 and 2011-2012, drifts down to about 19,000 GWh through the 2010s, collapses briefly to under 15,000 GWh in the 2020 lockdown, and falls further to about 17,000 GWh by 2023-2025. The lower panel plots the electricity production index (2019=100), which peaks near 113 around 2007-2008 and ends the series near 90."><figcaption><p><strong>Figure 5.1:</strong> Electricity Available for Distribution and Electricity Production Index, 2000–2025. <em>Source: Stats SA P4141 (series ELEKTS10, seasonally adjusted, and ELEKIN11). Note: Both panels show electricity supply peaking around 2007–2008 and declining since, with the sharpest falls in the 2020 lockdown and the 2022–2023 load-shedding years. The chart does not plot mining output; the close coupling of the Minerals-Energy Complex means that these supply disruptions fed directly into mining production (Figure 5.2 and Chapter 3), and mining's energy intensity made it particularly vulnerable to load shedding.</em></p></figcaption></figure>

The labour system was equally distinctive. Deep-level mining combined large numbers of low-wage manual workers with a smaller skilled tier (Lipton 1986). The Chamber of Mines (now the Minerals Council South Africa) built a migrant-labour regime: fixed-term contracts, single-sex compounds, and enforced family residence in rural homelands (Wilson and Ramphele 1989). This structure underpinned profitability and later apartheid controls by suppressing wages and denying permanent urban settlement (Wolpe 1988).

### Forward and Backward Linkages

The MEC generated substantial industrial linkages (Fine and Rustomjee 1996). Backward linkages developed in mining equipment, explosives manufacturing, engineering services, and financial services. Forward linkages emerged in minerals processing—iron and steel from iron ore, chemicals from coal, ferrochrome from chrome ore. Major conglomerates like Anglo American and Gencor developed integrated operations spanning mining, processing, manufacturing, and financial services (Freund 2019).

These linkages remained concentrated in capital-intensive sectors rather than diffusing into labour-intensive manufacturing (Kaplan 2004). Commodity-export strength also generated Dutch Disease effects via exchange-rate appreciation, reducing non-resource competitiveness. Concentrated ownership—six conglomerates controlled over 80% of JSE value during apartheid—further limited competitive diversification pressures (Marais 2011).

### Post-Apartheid Transformation: B-BBEE and the Mining Charter

Democracy introduced a dual imperative: transform ownership while sustaining investment and output (Capps 2012). The 2002 MPRDA shifted mineral rights to state custodianship and required conversion to new rights tied to transformation conditions. Botha (2026) argues this shift, combined with regulatory and administrative bottlenecks, has contributed materially to long-term decline—employment fell sharply and detailed geological mapping for exploration remains very limited.

The Mining Charter, first promulgated in 2004 and subsequently revised in 2010, 2017, and 2018, established Broad-Based Black Economic Empowerment (B-BBEE) ownership targets alongside requirements for preferential procurement, employment equity, skills development, and community development (DMR 2018). The initial target of 26% black ownership by 2014 created a wave of B-BBEE transactions, transferring equity worth tens of billions of rands to black investors (Capps 2012). Major deals included the formation of African Rainbow Minerals (Patrice Motsepe), Exxaro Resources, and Royal Bafokeng Holdings (Minerals Council South Africa 2023).

Implementation remained contentious (Capps 2012). Firms argued for a "once empowered, always empowered" principle, while government insisted on continuing ownership consequences. The 2018 Charter partially settled this dispute, raised ownership targets to 30%, and tightened procurement and community obligations (DMR 2018).

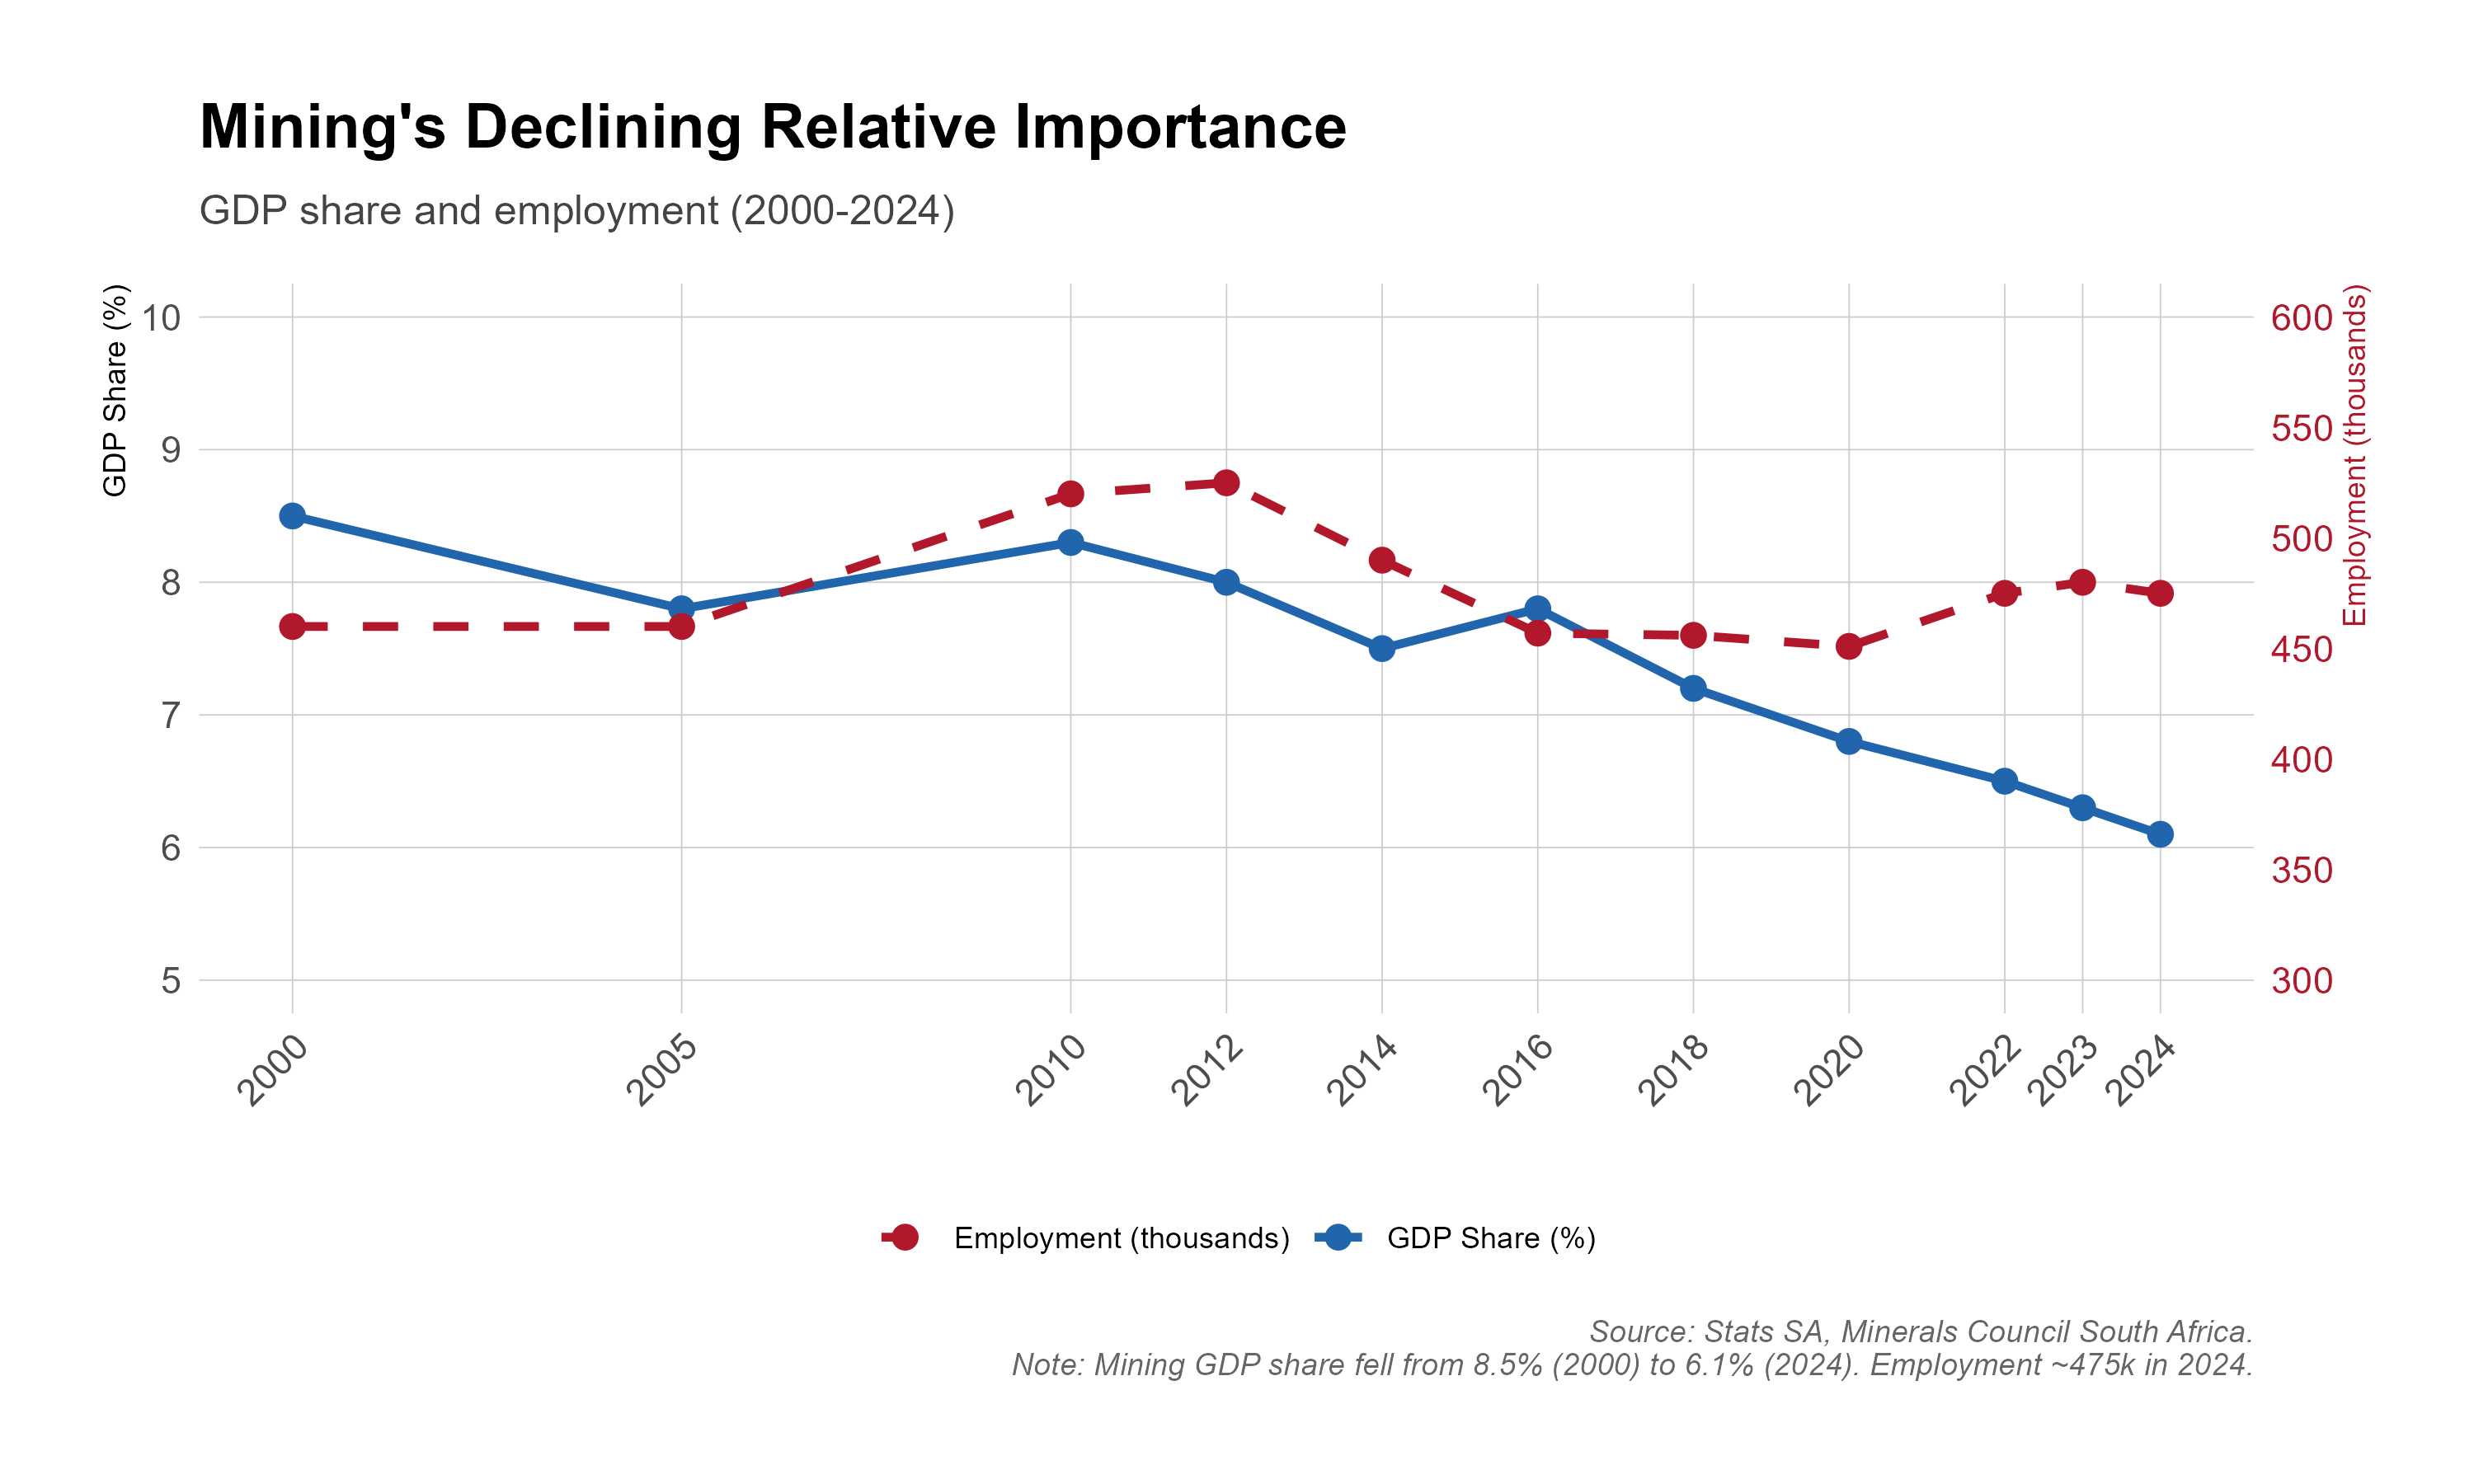
**Figure 5.2** tracks mining's declining relative weight—its GDP share falling from 8.5 percent in 2000 to 6.1 percent in 2024—alongside the long slide in direct employment.

<figure><img src="https://1783163384-files.gitbook.io/~/files/v0/b/gitbook-x-prod.appspot.com/o/spaces%2FL8lYh8bJlWCut8kRKSUq%2Fuploads%2Fgit-blob-8a89424edccb119e178bade3983bc2eb6643a263%2Ffig_5_2_mining_gdp.png?alt=media" alt="Dual-axis line chart, 2000 to 2024. Mining&#x27;s share of GDP (solid line, left axis) falls from 8.5% in 2000 to 7.8% in 2005, recovers to about 8.3% in 2010 and then declines to 6.1% in 2024. Mining employment in thousands (dashed line, right axis) rises from about 460,000 in 2000 to a peak of about 525,000 in 2012, falls to about 450,000 in 2020 and recovers to about 475,000 in 2024."><figcaption><p><strong>Figure 5.2:</strong> Mining Sector GDP Share and Employment, 2000–2024. <em>Source: Stats SA; Minerals Council South Africa. Note: Mining's share of GDP has declined from 8.5% in 2000 (and around 8% through the early 2000s) to 6.1% in 2024. Within the charted period direct employment peaked at about 525,000 in 2012 and stood at around 475,000 in 2024; the late-1980s peak of around 760,000 discussed in the text lies outside the charted range, and the losses have been concentrated in gold mining.</em></p></figcaption></figure>

### Marikana: A Watershed Moment

On 16 August 2012, South African Police Service officers opened fire on striking mineworkers at Lonmin's Marikana platinum mine in North West province, killing thirty-four workers and injuring seventy-eight (Farlam Commission 2015). It was the single deadliest use of force by South African security services against civilians since the Sharpeville massacre of 1960, and it sent shockwaves through the mining industry, the labour movement, and the political establishment.

The immediate context was a wildcat strike by rock drill operators demanding R12,500 monthly wages—about double existing pay (Alexander 2013). The strike bypassed established bargaining channels. NUM had lost credibility among many workers, while AMCU rapidly expanded by channelling wage discontent (Capps 2012). Rival union dynamics plus stagnant real wages amid high executive pay and commodity gains produced a volatile confrontation (Hartford 2013).

The Farlam Commission investigated the events over two years (Farlam Commission 2015). It found institutional failures across Lonmin, SAPS, and union actors: unmet Social and Labour Plan commitments, excessive police force, and escalation dynamics in labour relations. It recommended further investigation of officers involved, but prosecutions were limited and largely unsuccessful.

Marikana reshaped the platinum sector. A five-month strike in 2014—the longest in South African mining history—raised wages and labour costs materially (Minerals Council South Africa 2023). AMCU displaced NUM on the platinum belt, marginal shafts closed under cost and price pressure, and sector employment declined from over 190,000 to around 160,000 by 2020 (Minerals Council South Africa 2023).

Marikana's significance extended far beyond platinum. It exposed deep inequality between workers, executives, and host communities, highlighted limits in post-apartheid labour relations, and damaged investor confidence by amplifying perceptions of regulatory and political risk (Alexander 2013; Minerals Council South Africa 2023). De Kadt, Johnson-Kanu, and Sands (2024) also show major electoral effects in affected communities, linking Marikana to broader political realignment. It remains a reference point in debates on labour, regulation, and distribution of mineral rents.

***

## III. Mining Sector Performance and Key Minerals

### Contribution to the Economy

Mining's GDP share has declined from around 8–9 percent in the early 2000s to roughly 6 percent by 2024 (Statistics South Africa 2023), reflecting gold contraction and faster service-sector expansion. But mining still contributes over 40 percent of merchandise exports, and fiscal receipts remain materially commodity-price dependent.

Mining employment has trended downward with cyclical variation (Statistics South Africa 2023). From a peak of around 760,000 in the late 1980s, direct employment has fallen to approximately 475,000 in 2024 (Minerals Council South Africa 2023), with the sharpest losses in gold. Growth in PGMs, coal, and iron ore partly offset losses, but net contraction has been substantial in a sector that historically offered relatively good wages for workers with limited formal schooling (Seekings and Nattrass 2005).

### Productivity and Competitiveness Challenges

South African mining faces significant productivity challenges (Minerals Council South Africa 2023). In gold mining, production per worker has declined as mines have depleted higher-grade ore bodies accessible from existing shafts, forcing operations into deeper, lower-grade deposits. The deepest gold mines now operate at more than 3.5 kilometres below surface—the deepest mines on earth—and the remaining reserves lie predominantly at great depth. These extreme depths impose enormous costs for cooling, ventilation, rock support, and worker safety.

Rising input costs compound geological challenges. Electricity prices increased roughly tenfold in nominal terms between 2007 and 2024—approximately fourfold in real terms (PowerOptimal 2024)—as Eskom has struggled with maintenance backlogs, new-build cost overruns, and the financial legacy of state capture documented in Chapter 3. Mining accounts for approximately 15 percent of national electricity consumption, making the sector acutely vulnerable to both price increases and the load-shedding disruptions that persisted until mid-2025 (Eskom 2024). Real wage increases—particularly following the 2012 Marikana massacre and subsequent platinum strikes—have added to cost pressures, even as productivity has stagnated (Farlam Commission 2015).

### Key Mineral Commodities

**Platinum Group Metals (PGMs):** South Africa dominates global PGM production, accounting for approximately 70% of platinum and 80% of rhodium output (DMRE 2023). The Bushveld Complex, a massive geological formation underlying much of Limpopo and North West provinces, contains the world's largest PGM reserves by a substantial margin (Minerals Council South Africa 2023). PGM demand has historically been driven by autocatalytic converters for emission control in vehicles, but emerging applications in hydrogen fuel cells for the green transition could provide a significant new demand source (IEA 2023).

The PGM sector has experienced profound rationalisation following the 2012 Marikana events and subsequent extended strikes (Farlam Commission 2015). Several marginal shafts have been closed, and employment has fallen from over 190,000 to approximately 160,000 (Minerals Council South Africa 2023). Productivity has improved through mechanisation and the closure of the least efficient operations, but the sector remains vulnerable to substitution risk as battery electric vehicles—which require no catalytic converters—gain market share (IEA 2023).

**Coal:** Coal remains South Africa's most important mineral by volume, with annual production of approximately 250 million tonnes (DMRE 2023). Domestic consumption—predominantly for Eskom's power stations—accounts for roughly three-quarters of production, with the remainder exported primarily through Richards Bay Coal Terminal (Minerals Council South Africa 2023). Coal mining employs approximately 90,000 workers directly, with substantial additional employment in transport and port operations (Statistics South Africa 2023).

The coal sector faces an existential threat from global decarbonisation (IEA 2023). International demand for thermal coal has peaked and will decline as Asian economies—particularly China, India, and Southeast Asia—shift to renewables and gas. Domestic demand will fall as Eskom retires ageing coal-fired power stations and replaces capacity with renewables and gas (CSIR 2024). The just transition in coal-dependent regions of Mpumalanga represents one of South Africa's most significant economic challenges (PCC 2022; Burton et al. 2018).

**Gold:** Gold mining has experienced the most dramatic decline of any South African mineral (DMRE 2023). Production has fallen from peaks exceeding 1,000 tonnes annually in the 1970s to approximately 100 tonnes—a decline of over 90% (Minerals Council South Africa 2023). South Africa has fallen from the world's largest gold producer to outside the top ten, overtaken by China, Australia, Russia, and several others. Employment has contracted from over 400,000 at peak to below 100,000 (Statistics South Africa 2023).

This decline reflects primarily geological exhaustion (Minerals Council South Africa 2023). The richest portions of the Witwatersrand reef have been mined out, leaving lower-grade deposits at extreme depths. Mining costs have increased accordingly, and many operations are marginal even at current elevated gold prices. The sector's future lies in extending the life of existing operations rather than significant new development (DMRE 2023).

**Iron Ore and Manganese:** South Africa is a significant exporter of iron ore (primarily from the Northern Cape) and the world's largest producer of manganese (DMRE 2023). These minerals—essential inputs to steel production—benefit from proximity to bulk commodity ports and relatively simple processing requirements (Minerals Council South Africa 2023). Production and exports have grown substantially over the democratic era, though constrained by Transnet rail capacity limitations discussed in Chapter 3 (Transnet 2024). **Figure 5.3** plots production of gold, platinum and coal since 2010, showing the divergence between gold's continued contraction and the relative stability of platinum and coal.

<figure><img src="https://1783163384-files.gitbook.io/~/files/v0/b/gitbook-x-prod.appspot.com/o/spaces%2FL8lYh8bJlWCut8kRKSUq%2Fuploads%2Fgit-blob-1f1cfd9c2d554b720b99bbdf7ea1068b3c112b24%2Ffig_5_3_mineral_production.png?alt=media" alt="Three-panel line chart of annual mineral production levels, 2010 to 2024. Gold production in tonnes falls from 189 in 2010 to 89 in 2022 and 100 in 2024; platinum production in tonnes falls from 163 in 2010 to a low of 120 in 2020 and recovers to 130 in 2024; coal production in million tonnes rises from 255 in 2010 to 261 in 2014 and then declines to 225 in 2024."><figcaption><p><strong>Figure 5.3:</strong> Gold, Platinum and Coal Production, 2010–2024. <em>Source: Minerals Council South Africa; USGS Mineral Commodity Summaries. Note: The panels plot production levels, not indices. Gold output fell by 47 percent between 2010 and 2024 (189 to 100 tonnes), continuing the long decline from the 1970 peak described in the text; platinum fell from 163 to 130 tonnes, with a 2020 trough of 120; coal plateaued at 250–260 million tonnes before easing to 225 million tonnes in 2024. Iron ore and manganese, discussed in the text, are not plotted. Divergent trajectories reflect geological, market and policy factors.</em></p></figcaption></figure>

***

## IV. Commodity Cycles and Economic Vulnerability

### The 2000s Super-Cycle

South Africa's mining sector—and the broader economy—benefited enormously from the commodity super-cycle of the 2000s (World Bank 2018b). Driven by China's industrialisation and urbanisation, global demand for industrial commodities surged, pushing prices to historic highs (World Bank 2024). The terms of trade improved dramatically, the rand strengthened, and mining companies invested in capacity expansion and rehabilitation of previously marginal operations.

The super-cycle's benefits extended beyond mining itself. Strong export earnings financed imports of capital goods and consumer durables. Corporate tax revenues from mining companies funded social expenditure expansion (National Treasury 2008). Employment in mining and related sectors grew. The government reduced debt and accumulated reserves, with gross government debt falling below 30 percent of GDP by 2008.

### The Post-2011 Correction

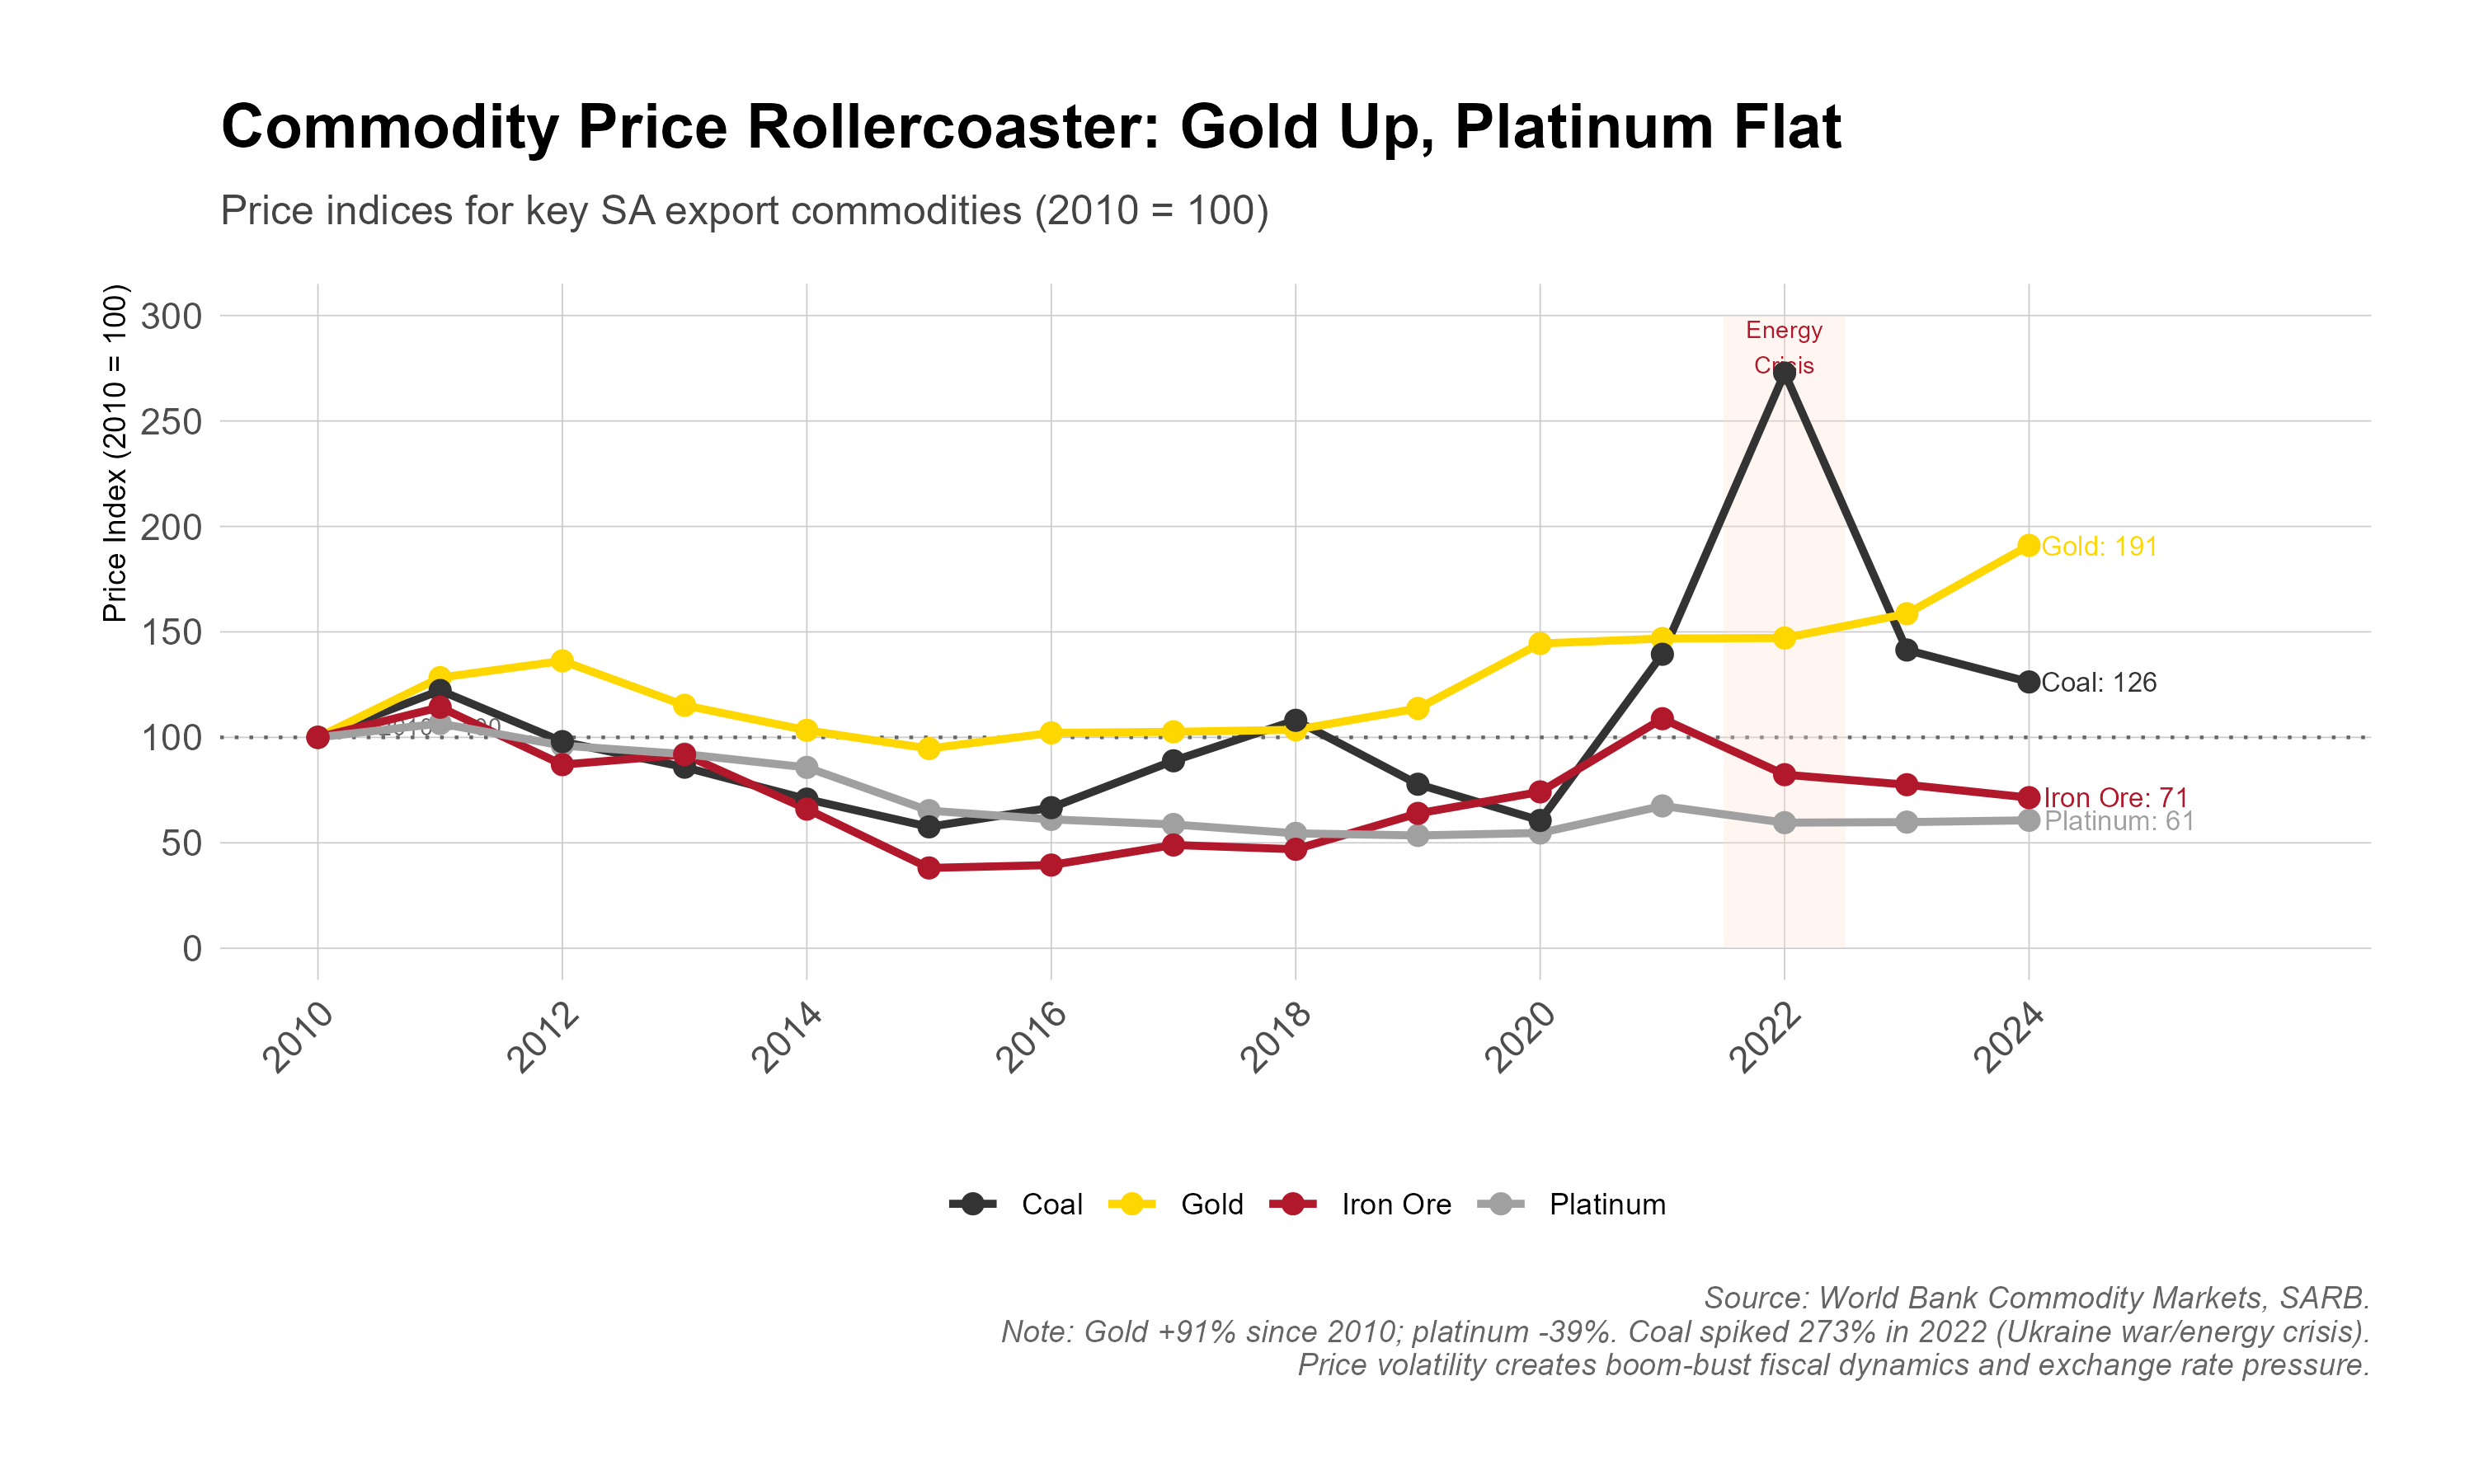
The post-2011 correction was painful (World Bank 2024). As Chinese growth slowed and global supply expanded, prices fell sharply in some commodities. Terms of trade worsened, the current account deficit widened, and the rand depreciated. Firms responded through cost-cutting, closures, and layoffs, with losses concentrated in gold and platinum (Minerals Council South Africa 2023). **Figure 5.4** shows how divergent price trajectories since 2010 have reshaped the sector's fortunes commodity by commodity.

<figure><img src="https://1783163384-files.gitbook.io/~/files/v0/b/gitbook-x-prod.appspot.com/o/spaces%2FL8lYh8bJlWCut8kRKSUq%2Fuploads%2Fgit-blob-cae6510db10fe858c595a4df7085346aa3fbbc94%2Ffig_5_4_commodity_prices.png?alt=media" alt="Indexed line chart (2010=100) of World Bank price indices for coal, gold, iron ore and platinum, 2010 to 2024, with the 2022 energy crisis shaded. Gold rises to 191 by 2024; platinum falls to 61; iron ore falls to 71 after troughs near 40 in 2015-2016; coal falls below 60 in 2015 and 2020, peaks at 273 in 2022 and ends at 126."><figcaption><p><strong>Figure 5.4:</strong> Commodity Price Trends (2010=100). <em>Source: World Bank Commodity Price Data. Note: Divergent price trajectories since 2010 have reshaped the mining sector. Gold has risen 91% (index 191 in 2024) while platinum has fallen 39% (index 61) and iron ore ended at 71; the coal price index peaked at 273 (2010=100) in 2022 during the energy crisis before falling back to 126 in 2024.</em></p></figcaption></figure>

### Managing Commodity Volatility

Commodity dependence complicates macro management. Booms appreciate the exchange rate and weaken other tradables (Dutch Disease), while fiscal windfalls create spending pressures that are hard to unwind. Busts reverse these dynamics and amplify contraction.

South Africa's volatility management has been mixed. Debt fell below 30 percent of GDP by 2008, showing partial saving during the boom, but fiscal policy was not strongly counter-cyclical and expenditure ratcheted up. Without explicit stabilisation instruments, outcomes depended on discretionary choices that proved hard to sustain.

***

## V. Beneficiation and Value Addition

### The Beneficiation Debate

Few mining-policy topics are as contested as beneficiation—domestic processing of minerals before export. Advocates argue that raw exports forfeit domestic value and jobs (dtic 2007–2019): why export iron ore instead of steel, or raw chrome instead of ferrochrome?

The appeal is intuitive: processed products fetch higher prices, and countries like South Korea and Japan industrialised using imported raw materials (Wade 1990). It seems reasonable that a resource-rich country should capture more downstream value.

Yet there are strong reasons for scepticism beyond electricity and logistics constraints.

**The jobs intensity problem:** Beneficiation is often justified on employment grounds, but modern processing is highly capital-intensive and increasingly automated (Rodrik 2016). Smelters and steel plants require heavy capital for relatively low labour absorption. Even where beneficiation works, employment multipliers can be weaker than in services (Statistics South Africa 2023).

**Anachronistic development thinking:** Beneficiation priorities often reflect older industrialisation models (Hirschman 1958). Today, services dominate value creation and employment in most advanced economies. Many successful post-1990 developers, including Mauritius and Costa Rica, relied heavily on services and human capital rather than heavy industry (Ghani and O'Connell 2014). Replicating older models may misallocate scarce resources.

**Comparative advantage still matters:** Resource endowment alone does not guarantee processing competitiveness. South Africa faces high power costs, logistics weaknesses, skill constraints, and distance from major markets (Kaplan 2004; CDE 2014). Mandated beneficiation can destroy value if enabling conditions are absent, reducing extraction investment without creating globally competitive downstream industry (World Bank 2018).

### Policy Interventions

South African governments have pursued beneficiation through multiple mechanisms. The Industrial Policy Action Plan (IPAP) identified beneficiation as a priority, establishing targets for local content requirements in government procurement and incentives for processing investments (dtic 2007–2019). The Beneficiation Strategy for the Minerals Industry (Department of Mineral Resources 2011) set ambitious targets for each mineral, calling for significant increases in domestic processing of iron ore, manganese, coal, PGMs, and others (DMR 2011).

Implementation has produced limited results. The Saldanha steel plant—once the largest single beneficiation investment—was mothballed in 2020 after struggling with high electricity costs, logistics challenges, and global steel oversupply. Ferrochrome production has grown but remains constrained by electricity availability and pricing. PGM beneficiation has progressed further than for any other mineral: South Africa refines most of its PGMs domestically and hosts a substantial autocatalyst manufacturing industry—BASF and Umicore at Gqeberha, Johnson Matthey at Germiston—that has in some years been the country's largest manufactured export by value (Minerals Council South Africa 2023). Beyond catalysts, however, the PGM value chain remains thin.

### Constraints on Beneficiation

Several structural factors explain limited beneficiation success:

**Energy costs and availability:** As Section III noted, electricity prices have risen roughly fourfold in real terms since 2007, and load shedding disrupted continuous processing operations that require stable power supply throughout the crisis years. Although load shedding ended by mid-2025, energy-intensive processing—steel, aluminium, ferrochrome—continues to face cost disadvantages against competitors with cheaper power (CSIR 2024).

**Logistics infrastructure:** Moving processed goods requires efficient transport, but Transnet's deterioration—examined in detail in Chapter 3—has created bottlenecks that add costs and delays (Transnet 2024). Container handling at ports is slow and expensive by international standards (World Bank 2023).

**Skills constraints:** Advanced manufacturing requires technical skills in short supply domestically. Training pipelines have not kept pace with industry needs, and immigration policies have not facilitated skills importation (CDE 2014).

**Market access:** Processed goods face trade barriers that raw materials do not, and the rupture in United States trade relations in 2025 sharpened this asymmetry. The "reciprocal" tariff regime announced by the US in April 2025—applied to South Africa at 30 percent from August 2025 after a ninety-day suspension—excluded platinum group metals, gold, coal, manganese, and chrome under its critical-minerals exemptions, leaving mining relatively sheltered compared with automotive and agricultural exporters (White House 2025; Mining Weekly 2025). But the exemption structure compounds the beneficiation dilemma: South Africa's dominant mineral exports to the US—PGMs above all—enter duty-free precisely because they are inputs to American industry, while further-processed manufactures face the full 30 percent tariff, and the lapse of AGOA's authorisation on 30 September 2025 removed the preferential access on which processed exports had relied (Edwards and Chien 2025). The regime shifted again in February 2026: AGOA was renewed retroactively for one year with South Africa's eligibility intact, and after the US Supreme Court struck down the IEEPA-based tariffs on 20 February the administration substituted a temporary 10 percent global surcharge under Section 122 of the Trade Act of 1974, whose exemption schedule again spared critical minerals and precious metals. The asymmetry thus survived the legal upheaval intact: at the end of February 2026 South Africa's raw mineral exports still entered the US duty-free while further-processed goods bore the surcharge—and steel and aluminium the full Section 232 duties (see Chapter 6). Under EPA arrangements South African manufactures retain preferential access to the EU, but they compete at a disadvantage against established producers with scale economies and market proximity (WTO 2022).

### The Value Chain Economics

Why beneficiation succeeds for some minerals but fails for others illuminates the economics of value chains more broadly. The critical variables are energy intensity, proximity to end markets, skills requirements, and the ratio of raw material cost to total product cost—and these vary enormously across minerals.

PGMs represent South Africa's most notable beneficiation success, albeit a partial one (Minerals Council South Africa 2023). The country refines the vast majority of its mined PGMs domestically, and a catalytic converter manufacturing industry has developed at Gqeberha and Germiston that serves both domestic vehicle assemblers and export markets—autocatalysts have in some years been South Africa's largest manufactured export by value. This success reflects specific advantages: PGM refining is technically complex but not exceptionally energy-intensive relative to value; South Africa's dominance in supply (70% of global platinum) gives buyers limited alternatives; and the high value-to-weight ratio of refined PGMs makes transport costs a negligible share of the final product price (DMRE 2023). Yet even in PGMs, the value chain beyond catalysts is thin: the fabrication of fuel cell stacks, PGM-based chemicals, glass and electronics applications, and the integration of catalysts into complete exhaust systems occur overwhelmingly in Europe, Japan, and the United States, near the automotive plants and end consumers they serve.

At the opposite extreme, iron ore beneficiation into steel faces prohibitive obstacles. Steelmaking is extraordinarily energy-intensive, but the form of energy matters. Conventional blast furnaces run on coking coal, which South Africa largely lacks; the alternative routes—direct reduction and electric-arc furnaces, and the Corex–Midrex configuration chosen for Saldanha precisely so that local iron ore and non-coking coal could be used—depend heavily on electricity. Eskom's steep tariff increases since 2008 therefore turned what had been designed as a cost advantage into a decisive disadvantage, rendering Saldanha's output uncompetitive. The value-to-weight ratio is unfavourable: steel is heavy and expensive to transport, favouring production near consumption markets. China, which produces over half the world's steel, has massive scale advantages and lower energy costs. The closure of the Saldanha steel plant in 2020 demonstrated these realities starkly.

The skills dimension is frequently underestimated in beneficiation debates. Advanced minerals processing requires metallurgical engineers, chemical engineers, process control technicians, and maintenance specialists—precisely the technically skilled workers that South Africa's education system produces in insufficient numbers (National Planning Commission 2012). The human capital bottleneck examined in Chapter 9 thus directly constrains beneficiation potential: even where energy and logistics conditions are favourable, the absence of an adequate skills pipeline limits what can be achieved.

Botswana's experience with diamond beneficiation offers an instructive comparison. Through its partnership with De Beers, Botswana successfully attracted diamond cutting and polishing operations to Gaborone, creating several thousand skilled jobs. This success rested on specific conditions: Botswana's dominance in gem-quality diamond supply gave it bargaining power; diamond cutting is skill-intensive but not energy-intensive; and the government invested systematically in training programmes for diamond artisans. Yet even Botswana has found that most value addition in the diamond pipeline—jewellery design, marketing, retail—remains concentrated in established centres like Antwerp, Mumbai, and New York. The lesson is that beneficiation can capture some value-chain segments but rarely the most lucrative ones, which depend on market access, brand equity, and accumulated expertise rather than proximity to raw materials.

### Alternative Development Paths

Beneficiation's persistence raises a broader question: is South Africa pursuing the right development strategy?

Many successful emerging-market growth stories did not rely on classic heavy-industry trajectories (Ghani and O'Connell 2014). India grew strongly through services, Mauritius diversified via tourism and finance, and even China now derives over half of GDP growth from services.

Given South Africa's unemployment crisis, the core question is not whether beneficiation can add value in selected cases, but whether it can create jobs at scale. In most cases it cannot. A modern steel plant can absorb billions in capital for limited direct employment, while similar capital in education, healthcare, tourism, or digital infrastructure may generate larger labour-market and development returns (Rodrik 2016).

This is not an argument to abandon mining or manufacturing. It is an argument against treating beneficiation as the central development lever. Scarce policy attention and investment may yield better returns in:

* **Services productivity:** Improving efficiency in retail, logistics, financial services, and professional services, which already employ millions (Chapter 7)
* **Human capital:** Fixing the education system (Chapter 9) to produce workers capable of participating in the modern economy
* **Tourism and hospitality:** Leveraging natural and cultural assets for labour-intensive services employment
* **Digital infrastructure:** Enabling participation in the global digital economy, where South Africa has demonstrated capability (Chapter 7)

South Africa should manage its mineral endowment prudently—taxing rents, regulating extraction, and investing for future generations. But expecting large-scale employment and structural transformation from beneficiation alone is likely a policy mirage.

***

## VI. Environmental and Social Footprint of Mining

### Environmental Impacts

Mining has left severe environmental legacies (Federation for a Sustainable Environment 2023). A century of deep-level extraction created extensive voids, abandoned shafts, and tailings. Rehabilitation liabilities are enormous—estimates range from tens of billions to over a hundred billion rand—and are often underfunded or left without clearly identifiable responsible entities after restructuring and bankruptcy (Oelofse et al. 2007).

**Land Degradation:** Mining has degraded millions of hectares through excavation, waste disposal, and subsidence (DMRE 2023). Tailings storage facilities—some covering hundreds of hectares and containing hundreds of millions of tonnes of processed waste—pose risks of dam failure, dust generation, and groundwater contamination (Federation for a Sustainable Environment 2023).

### Acid Mine Drainage and Rehabilitation

The most severe environmental challenge is acid mine drainage (AMD) from abandoned gold mines. In the Witwatersrand basin the problem has reached the scale of one of Africa's worst environmental crises. Over 130 years of gold mining created an interconnected labyrinth of underground voids spanning hundreds of kilometres beneath Johannesburg and surrounding areas (Oelofse et al. 2007). When active mining ceased and dewatering pumps were switched off, these voids began flooding with groundwater that reacts with pyrite and other sulphide minerals exposed by mining, generating sulphuric acid at concentrations sufficient to dissolve heavy metals—including uranium, manganese, iron, and arsenic—from surrounding rock (Federation for a Sustainable Environment 2023).

The volumes involved are staggering. The Western Basin alone has for over a decade been decanting an estimated 15 to 20 megalitres of contaminated water per day into the Tweelopie Spruit and Crocodile River system, polluting rivers, groundwater, and soil (Department of Water and Sanitation 2023). The Central Basin, underlying parts of central Johannesburg, poses particular concern because of the density of settlement above it and the potential for contaminated water to reach the Vaal River system—the primary water source for Gauteng's population of over 15 million (Oelofse et al. 2007). Testing of surface water and groundwater near decant points has revealed heavy metal concentrations far exceeding safe drinking water standards, with elevated uranium levels of particular concern given the Witwatersrand reef's naturally occurring radioactive materials.

The health impacts on surrounding communities, while difficult to isolate epidemiologically, are deeply worrying. Communities in Tudor Shaft, Riverlea, and other informal and formal settlements near mine tailings and decant points report elevated rates of respiratory illness, skin conditions, and gastrointestinal disorders (Federation for a Sustainable Environment 2023). Windblown dust from unrehabilitated tailings deposits—some located within residential areas—contains silica, heavy metals, and low-level radioactive material. Children playing on tailings dumps and residents using contaminated water for household purposes face chronic exposure to hazardous substances.

Remediation costs are substantial. The Department of Water and Sanitation's treatment plants across the major basins have absorbed billions of rand in capital outlay and carry substantial recurring operating costs. These systems mitigate immediate pollution but do not solve root causes: long-term solutions—passive treatment, underground sealing, or ongoing pumping—require decades of sustained investment (Oelofse et al. 2007).

Who pays for rehabilitation remains unresolved. NEMA and the MPRDA require provisioning, but many large liabilities predate these rules and responsible firms are often defunct or legally diffuse (DMRE 2023). Estimates of the total liability range from tens of billions to over a hundred billion rand, while available financial provisions cover only a fraction. Audit evidence shows weak compliance in mine closure processes, leaving a growing liability likely to revert to the state and taxpayers (Auditor-General South Africa 2023).

### Social Impacts

**The Migrant Labour Legacy:** The mining industry's migrant labour system created social devastation that persists today (Wilson and Ramphele 1989). Generations of men lived in single-sex hostels, separated from families for 11 months of each year. This system—which spread HIV/AIDS along migrant routes, fragmented families, and created unstable communities in both sending and receiving areas—was central to apartheid's political economy (Nattrass 2004). Its effects persist in elevated HIV prevalence in mining areas, disrupted family structures, and communities with limited economic alternatives to mining employment (Coovadia et al. 2009).

**Community Displacement and Conflict:** Mining operations have displaced communities, appropriated land, and disrupted livelihoods (Claassens and Cousins 2008). The requirements for community consultation and benefit-sharing under the Mining Charter have improved practices, but conflicts persist (DMR 2018). Communities complain of inadequate compensation, unfulfilled social labour plan commitments, and environmental damage without remediation (High Level Panel 2017).

**Informal Mining (Zama-Zamas):** The decline of formal gold mining has been accompanied by the rise of informal mining in abandoned shafts and tailings (Minerals Council South Africa 2023). An estimated 30,000 or more "zama-zamas" (a Zulu term meaning "keep trying") operate in dangerous, illegal conditions. Many are undocumented migrants from other African countries. Safety conditions are appalling—deaths from rock falls, flooding, and gas exposure are common but largely unreported (DMRE 2023). Criminal syndicates control access to many sites, and violence is endemic.

The zama-zama crisis represents a failure of mining closure policy. Formal mining companies, upon closing shafts, have inadequate obligations to secure sites and prevent informal access (Oelofse et al. 2007). Many abandoned mines lack identified owners, having been left by companies that subsequently restructured or went bankrupt. The police response has been largely ineffective, and the social drivers—unemployment, desperate migrants, viable gold deposits—persist (Seekings and Nattrass 2005).

**Construction Mafias and Extortion:** A significant and growing impediment to mining infrastructure development is the proliferation of "construction mafias"—criminal groups that extort protection payments from contractors and halt projects that refuse to pay (Business Leadership South Africa 2023). What began as localised extortion in KwaZulu-Natal has spread nationally, affecting mining, construction, and infrastructure projects across all provinces. Groups demand 30% or more of project value, threaten workers and managers with violence, and have demonstrated willingness to carry out those threats. Several major mining expansion and maintenance projects have been delayed or abandoned due to extortion.

The construction mafia phenomenon raises costs, deters investment, and compounds the infrastructure challenges discussed in Chapter 3. Projects in remote mining areas—where police presence is limited and alternative contractors scarce—are particularly vulnerable. Mining companies have responded by hiring private security, varying contractor identities, and in some cases simply accepting extortion as a cost of doing business. The SAPS has struggled to prosecute cases despite their visibility, reflecting broader state capability constraints. The result is an effective tax on mining investment—one that flows to criminal networks rather than the fiscus and that further undermines South Africa's attractiveness for resource development.

### Mining and Community Development

The Mining Charter requires holders of mining rights to submit Social and Labour Plans (SLPs) detailing commitments to local economic development, skills training, and infrastructure provision in mining-affected communities. SLPs were conceived as a mechanism to ensure that mining communities share directly in the benefits of extraction—addressing a historical injustice in which mineral wealth flowed to distant shareholders while host communities bore environmental and social costs with little compensation (High Level Panel 2017).

In principle, SLPs should channel substantial resources to mining communities. Each mining right holder must submit a five-year plan with specific, costed commitments across several categories: human resources development (skills training and bursaries), local economic development (infrastructure and enterprise development projects), and housing and living conditions for mineworkers. The aggregate value of SLP commitments across the industry runs to billions of rands per five-year cycle (Minerals Council South Africa 2023).

In practice, however, compliance and delivery have been deeply uneven. A 2017 review by the High Level Panel on the Assessment of Key Legislation found that the DMRE lacked the capacity to effectively monitor SLP implementation, and that many mining companies treated SLP commitments as a regulatory formality rather than a binding obligation (High Level Panel 2017). Projects were frequently delayed, downscaled, or abandoned, with limited consequences for non-compliance. As documented by the Centre for Applied Legal Studies, community development projects listed in SLPs have in some cases existed only on paper, while others delivered infrastructure—schools, clinics, roads—that was subsequently not maintained and fell into disrepair (Centre for Applied Legal Studies 2017).

The gap between community expectations and actual benefits has generated persistent conflict. Mining-affected communities, observing the scale of corporate revenues and executive remuneration, expect transformative investment in local services and infrastructure—expectations that SLPs, even when fully implemented, are not designed to meet (Capps 2012). The mismatch fuels protests, illegal blockades of mining operations, and demands for renegotiation. In some cases, traditional leaders and local elites have captured SLP benefits, directing resources to allies rather than to broader community needs—reproducing patterns of elite accumulation rather than broad-based development (Claassens and Cousins 2008).

The structural problem is that SLPs attempt to use mining companies as vehicles for local governance functions—building schools, clinics, and water infrastructure—that are properly the responsibility of local and provincial government (National Planning Commission 2012). Mining companies lack the institutional capacity, community accountability, and long-term commitment that effective service delivery requires. When mines close, the community development functions they have assumed typically collapse. A more effective approach would combine appropriate taxation and royalty regimes—ensuring the fiscus captures a fair share of mineral rents—with strengthened local government capacity to deliver services funded from those revenues. The current system, which substitutes corporate social investment for public governance, satisfies neither mining companies nor communities.

***

## VII. The Just Transition in Mining

### Decarbonisation and Coal's Future

Global decarbonisation poses existential challenges for South Africa's coal sector (IEA 2023). International thermal coal demand has peaked and will decline as countries implement climate commitments. South Africa's own electricity transition, as discussed in Chapter 3, will reduce domestic coal demand as ageing power stations retire and renewables plus gas provide new capacity (CSIR 2024). The combination of falling export and domestic demand threatens a sector that currently employs 90,000 workers directly and supports many more in transport and community services (Minerals Council South Africa 2023).

The just transition—decarbonisation that protects affected workers and communities—has become central in South African policy (PCC 2022). The PCC framework and the $8.5 billion JETP explicitly combine system transition with social protection (PCC 2022; Burton et al. 2018). As Chapter 3 (Section III.D) sets out, Montmasson-Clair's (2024) "three transitions" framework separates the coal, electricity, and economy-wide transitions, and the political economy of concentrated losses in coal communities means that neither carbon pricing nor renewable investment alone can manage the distributional politics—only integrated packages combining industrial policy, social protection, and credible regional development can.

### Mpumalanga: Ground Zero for Just Transition

Mpumalanga province concentrates South Africa's coal mining and coal-fired power generation (Eskom 2024). Most of Eskom's fifteen coal power stations are located in the province, along with the majority of coal mining operations (DMRE 2023). The province's economy is deeply dependent on coal—not just in mining and power generation but in transport, services, and local government revenue. Several municipalities derive the majority of their rates revenue from mining and power generation (PCC 2022).

The geographic concentration is stark. The eMalahleni (Witbank), Steve Tshwete (Middelburg), and Govan Mbeki (Secunda) local municipalities form the core of the coal belt, hosting most of Eskom's fifteen coal stations—including Duvha, Kendal, Matla, and Kriel—along with the Sasol coal-to-liquids complex. These three municipalities alone account for over 60,000 direct mining and energy jobs (DMRE 2023). Beyond the core, smaller municipalities like Lekwa, Msukaligwa, and Emakhazeni depend heavily on coal-related economic activity for employment and rates revenue. The spatial concentration means that the just transition is not an abstract national challenge but a concrete local emergency for specific communities—communities where alternative employment opportunities are scarce and where the municipal fiscus itself depends on mining and energy activity.

The transition challenge is immense (Burton et al. 2018). As power stations retire—several are already past their design lives—and mining operations close, tens of thousands of jobs will be lost. Communities that have developed around coal operations will lose their economic base. Workers with specialised skills in coal mining and power generation will need retraining for different industries (PCC 2022).

### Opportunities in Green Minerals

The energy transition that threatens coal also creates opportunities in "green minerals" essential for clean energy technologies (IEA 2023). South Africa's mineral endowment includes several strategically important resources:

**PGMs for Hydrogen:** Platinum is the primary catalyst in proton exchange membrane (PEM) fuel cells, and hydrogen economy growth could provide new demand sources as automotive catalytic converter demand declines (IEA 2023). South Africa's dominance in platinum production positions it to benefit, though the scale and timing of hydrogen adoption remain uncertain (Minerals Council South Africa 2023).

**Manganese for Batteries:** South Africa holds around 80 percent of the world's known manganese resources (the Kalahari field), though a considerably smaller share of economically mineable reserves (DMRE 2023). While most manganese currently goes to steel production, manganese-based battery chemistries are gaining interest as alternatives to lithium-ion (IEA 2023). Any significant shift towards manganese batteries would benefit South African producers.

**Other Critical Minerals:** Copper (essential for electrical systems), vanadium (for grid-scale batteries), and rare earths (for permanent magnets) all have South African deposits, though development has been limited by infrastructure constraints and policy uncertainty (DMRE 2023).

**The CBAM Challenge:** The European Union's Carbon Border Adjustment Mechanism (CBAM), whose transitional, reporting-only phase ran from October 2023 to the end of 2025 and whose definitive phase—with importers required to purchase certificates—began on 1 January 2026, creates an emerging "green trade barrier" for South African mineral exports—particularly energy-intensive products such as ferrochrome, steel, and aluminium that rely on Eskom's coal-dominated grid (Gasealahwe, Makrelov, and Ragavaloo 2024). Under CBAM, European importers must purchase certificates reflecting the carbon content of covered goods, effectively imposing a carbon cost on South African producers whose electricity supply is among the most emissions-intensive in the world. South African miners and processors must therefore decarbonise their electricity supply—through wheeling arrangements, rooftop solar, and self-generation under the amended Electricity Regulation Act—to maintain European market access. This imperative connects directly to the energy transition discussed in Chapter 3: the mining sector's competitiveness now depends not only on ore grades and labour costs but on the carbon intensity of the grid that powers extraction and processing.

***

### Comparative Policy Box: Indonesia's Nickel Downstreaming

Indonesia provides a compelling case of successful resource beneficiation (Hendrix 2019). Through export bans on unprocessed nickel implemented from 2014 and strengthened in 2020, Indonesia forced investment in domestic processing capacity. Nickel smelting investment exceeded $30 billion as Chinese and Korean investors built processing facilities to maintain access to Indonesian ore. Indonesia's share of global nickel processing has increased dramatically, and the country is now developing battery manufacturing capacity to move further up the value chain (IEA 2023).

The Indonesian success relied on several enabling conditions: (1) enormous nickel reserves that gave Indonesia market power other producers lacked; (2) coordinated investment in supporting infrastructure, particularly power generation; (3) willingness to accept short-term disruption for long-term development; and (4) active facilitation of foreign investment in processing capacity.

**Lessons for South Africa:** The Indonesian experience suggests that beneficiation can work but requires market power (from large reserves relative to global supply), infrastructure investment alongside regulatory measures, and acceptance that export restrictions alone are insufficient. South Africa has market power in PGMs and manganese but lacks it in iron ore or coal, suggesting selective rather than universal beneficiation approaches.

***

### Comparative Policy Box: Chile's Mining Governance

Chile's copper sector provides an alternative governance model emphasising institutional quality, fiscal stabilisation, and openness to private investment (De Gregorio and Labbé 2011). Copper provides approximately 50% of Chilean exports but a far smaller share of government revenue—under 10 percent in recent years—raised through state-owned Codelco and private-sector taxation (Schmidt-Hebbel 2006).

Chile's approach features:

* **Strong institutions:** Cochilco (copper commission) provides independent technical analysis; Codelco maintains world-class operations under professional management.
* **Fiscal stabilisation:** The structural balance rule and copper stabilisation fund smooth fiscal revenue over price cycles, building reserves during booms and drawing down during busts.
* **Investment openness:** Private international miners operate major projects under stable fiscal terms, bringing technology and capital.

**Lessons for South Africa:** Chile demonstrates that resource abundance can be managed effectively through institutional quality rather than extensive state intervention (Marcel et al. 2001). The fiscal stabilisation model—which South Africa lacks—addresses commodity volatility more effectively than discretionary policy. As Chapter 2's discussion of fiscal frameworks notes, South Africa has never implemented a formal commodity stabilisation fund despite repeated recommendations; mining revenues flow directly into the consolidated fiscus, where they are consumed in current expenditure rather than smoothed across commodity cycles. Chile's structural balance rule offers a template, but one that requires the kind of long-term fiscal commitment that South Africa's political economy has not sustained. However, Chile's reliance on a single commodity and limited success in beneficiation beyond refining suggest that its model is not a complete answer.

***

### Comparative Policy Box: India's Coal Transition Pilots

India, like South Africa, faces a just transition challenge in coal-dependent regions (IEA 2023). Indian pilot programmes in coal regions provide early lessons:

* **Economic diversification:** Investments in solar manufacturing, food processing, and tourism in coal districts aim to provide alternative employment.
* **Worker support:** Retraining programmes target displaced coal workers for solar installation, electric vehicle maintenance, and other green economy jobs.
* **Regional planning:** Just transition plans at the district level coordinate investments across sectors.

**Lessons for South Africa:** India's experience emphasises the importance of planning ahead of mine closures rather than responding after the fact. The focus on regional economic diversification—rather than worker-by-worker retraining alone—addresses the structural nature of the transition (Burton et al. 2018). Early pilots allow learning before full-scale implementation becomes necessary.

***

## Policy Debates and Reform Frontiers

Mining policy in South Africa is characterised by a peculiar stasis: the same debates recur across political cycles, the same commissions issue the same recommendations, and the same structural problems persist largely unaddressed. This is not for lack of analysis. The field is dense with research, advocacy, and international comparison. What is lacking is the political economy of implementation—the institutional capacity, the alignment of industry, labour, and government, and the sustained commitment required to translate policy intent into changed reality. This section maps the current debates, draws on international experience, and proposes a two-tier framework for thinking about reform possibilities.

### The Current Debate

Five fault lines run through contemporary mining policy in South Africa, each involving genuine trade-offs rather than simple failures of will.

**The Mining Charter and regulatory certainty.** The tension between transformation and investment confidence has festered since the MPRDA's enactment in 2002. The Minerals Council South Africa—the industry body representing major producers—has consistently argued that successive Charter revisions (2004, 2010, 2017, 2018) have created regulatory uncertainty that deters investment, particularly in exploration (Minerals Council South Africa 2023). The Department of Mineral and Petroleum Resources (DMPR, until 2024 part of the DMRE) counters that transformation targets remain unmet and that the industry has used "uncertainty" as a rhetorical device to resist change (DMRE 2023). The chilling effect on foreign direct investment is well documented: South Africa's share of global mining exploration expenditure fell from approximately 5% in the early 2000s to below 2% by 2020, a decline attributed partly to regulatory risk (Minerals Council South Africa 2023). The Fraser Institute's annual survey of mining jurisdictions consistently ranks South Africa in the bottom quartile for policy attractiveness (Fraser Institute 2024). Botha (2026) sharpens this critique, documenting that only a small fraction of South Africa's geology has been mapped at the detail necessary for new exploration—a failure of state capacity that compounds regulatory disincentives. The 2018 Charter brought partial stabilisation, but the underlying questions—how much ownership transfer is enough, whether the "once empowered, always empowered" principle applies, and what community development obligations attach to mining rights—remain unresolved.

**Beneficiation: realism versus aspiration.** The Centre for Development and Enterprise (CDE), drawing on its long programme of research on South Africa's mineral economy, has been consistently sceptical of mandated beneficiation, arguing that export restrictions and local content requirements destroy value without creating competitive industries (CDE 2014). The dtic's Sector Master Plans, by contrast, embed beneficiation targets across minerals—from PGM catalytic converters to ferrochrome to steel—treating downstream processing as an industrial policy imperative. TIPS occupies intermediate ground, acknowledging that beneficiation makes economic sense for some minerals (PGMs, where South Africa has dominant market share) but not others (iron ore, where energy costs are prohibitive). As the preceding section on value chain economics argued, the critical variable is not whether beneficiation is desirable in the abstract—it almost always is—but whether the specific conditions for competitive processing exist for each mineral in each location. Blanket mandates ignore these distinctions.

**Critical minerals and the green transition.** South Africa holds globally significant reserves of several minerals central to the energy transition: the Kalahari manganese field (see the discussion of green minerals above), dominant PGM deposits essential for hydrogen fuel cells, substantial vanadium resources for grid-scale redox flow batteries, and copper deposits of growing interest (DMRE 2023; IEA 2023). Both the Minerals Council and the dtic have identified critical minerals as a strategic opportunity, and the Department of Science and Innovation has funded research through the Hydrogen South Africa (HySA) programme on PGM applications in fuel cell technology (Department of Science and Innovation 2024). Yet South Africa lacks a coherent critical minerals strategy comparable to those adopted by the EU, the United States, and Australia (IEA 2023). The risk is that South Africa exports these minerals in raw form to countries that capture the manufacturing value—repeating, in a green economy context, precisely the pattern that beneficiation advocates have long decried.

**Resource rent taxation.** Whether South Africa captures an adequate share of mineral rents has been debated since at least the Davis Tax Committee's reports on mining taxation (Davis Tax Committee 2018). The current regime—comprising corporate income tax, the Mineral and Petroleum Resources Royalty Act (2008), and dividend withholding tax—captures a moderate share of rents by international standards but is vulnerable to transfer pricing and base erosion, particularly by multinational mining houses (Davis Tax Committee 2018). ERSA has produced careful analysis of mineral rent estimation, with Gillingham (2016) finding that effective tax rates on mining vary enormously by commodity and firm, and that the royalty regime—based on a formula linking rates to profitability—performs reasonably under normal conditions but captures less during commodity booms when rents are highest. The question is whether resource rent taxation should be higher, and if so, whether additional revenue should flow to a sovereign wealth fund, to mining communities, or to general revenue. National Treasury has been cautious, wary of deterring investment, but the declining competitiveness of the mining investment environment probably owes more to infrastructure and regulation than to the tax rate itself.

**The zama-zama crisis: criminalisation versus formalisation.** Illegal artisanal mining has grown into a humanitarian and security crisis, with an estimated 30,000 or more individuals working in abandoned and sometimes active mines (Minerals Council South Africa 2023). The dominant policy response has been criminalisation: police operations, arrests, and in some cases the sealing of mine shafts with people still underground. The 2024 Stilfontein crisis—part of Operation Vala Umgodi ("close the hole")—brought international attention when authorities deliberately blocked supply routes to underground shafts to force hundreds of illegal miners to the surface, resulting in a protracted security standoff and humanitarian emergency rather than an accidental entrapment. A court-ordered rescue operation in January 2025 brought 246 survivors to the surface and recovered 78 bodies. The episode laid bare the human cost of a purely enforcement approach and sharpened the debate between criminalisation and formalisation. Civil society organisations, including the Bench Marks Foundation and the Centre for Applied Legal Studies, have argued for a formalisation pathway—licensing artisanal miners, establishing safety standards, and integrating small-scale mining into the formal economy (Bench Marks Foundation 2023). International experience from Ghana, Tanzania, and Colombia suggests that formalisation, while difficult, can reduce mortality, capture tax revenue, and diminish the role of criminal syndicates (World Bank 2019). The political obstacles are real: formal mining companies oppose formalisation because it could legitimate competitors on their concessions; the DMPR lacks the administrative capacity to regulate thousands of small-scale operations; and organised crime networks are deeply entangled. Yet the status quo—periodic enforcement operations that temporarily disperse miners who then return—is plainly not working.

### International Lessons

South Africa is hardly the only country wrestling with how to govern mineral wealth for broad-based development. Four international cases are instructive, though each comes with caveats about transferability.

**Botswana's diamond partnership model.** Botswana is routinely cited as Africa's mineral governance success story, and with good reason (Acemoglu, Johnson, and Robinson 2003). The Debswana partnership—a 50-50 joint venture between the Government of Botswana and De Beers—has channelled diamond revenues into public investment in education, health, and infrastructure since the 1960s. The Pula Fund, Botswana's sovereign wealth fund, has accumulated reserves exceeding $4 billion, providing a buffer against commodity price volatility and a savings vehicle for intergenerational equity (Bank of Botswana 2023). Botswana's per capita income growth since independence has been among the fastest in the world, according to World Bank data.

The lessons are real but transfer is limited. Botswana's population of 2.4 million means that diamond revenues per capita are extraordinarily high—a ratio that South Africa, with 63 million people and a more diversified mineral sector, cannot replicate. Botswana's success also rested on unusually strong post-independence institutions, including a pre-colonial tradition of consultative governance among the Tswana that Acemoglu, Johnson, and Robinson (2003) identify as critical. And the partnership model worked partly because De Beers controlled global diamond marketing through a cartel—market power that is eroding as synthetic diamonds gain share. Still, the principle of direct state participation in mineral extraction—with revenues ring-fenced for savings and investment rather than absorbed into general expenditure—offers a model that South Africa has never seriously attempted.

**Norway's Government Pension Fund.** Norway's sovereign wealth fund—the world's largest at approaching $2 trillion—represents the gold standard of resource rent capture for intergenerational equity (Norges Bank Investment Management 2024). Established in 1990, the fund receives all net government revenues from petroleum activities and invests them in global financial markets. A fiscal rule limits annual government withdrawals to approximately 3% of the fund's value, ensuring that petroleum wealth is converted into permanent financial wealth rather than consumed by current generations (Lie 2018).

The Norwegian model is admired precisely because it seemed radical when proposed. In the 1970s and 1980s, the conventional wisdom held that oil revenues should be spent on domestic development; investing them abroad struck many as perverse. Today, the fund's success has made sovereign wealth funds mainstream—a reminder that policy ideas dismissed as utopian in one era become conventional wisdom in the next. For South Africa, the lesson lies less in the fund's scale (which reflects decades of petroleum revenues that South Africa lacks) than in the institutional architecture: a clear rule separating extraction revenues from the annual budget, independent professional management, and a political commitment to long-term savings that has survived multiple changes of government. Even a modest South African mining revenue fund, starting with a fraction of royalty income, could establish the institutional precedent.

**Chile's lithium nationalisation debate (2023).** In April 2023, President Gabriel Boric announced that Chile would require majority state ownership of future lithium extraction, designating lithium a "strategic" resource essential to the energy transition. Chile holds the world's largest lithium reserves and is the second-largest producer. The policy—which affects only new contracts, not existing operations by SQM and Albemarle—represents a significant shift from Chile's historically open investment regime in mining.

The Chilean debate is instructive for what it reveals about the political economy of critical minerals. As demand for battery minerals surges with electric vehicle adoption, resource-holding countries face growing pressure to capture more of the value chain rather than merely export raw materials. Chile's approach—partial nationalisation of a strategic mineral while preserving private participation—represents a middle path between full state control (as in Bolivia's failed lithium programme) and a purely market-driven approach. For South Africa, the parallel is PGMs and manganese: minerals where the country has dominant global reserves and where the energy transition is creating new strategic value. Whether South Africa has the state capacity to be an effective partner in mineral extraction is another matter—the track record of the DMPR and its predecessor on licensing and regulation does not inspire confidence.

**Indonesia's nickel export ban.** The Comparative Policy Box earlier in this chapter set out the Indonesian case—the 2014 and 2020 export bans, the more than $30 billion in smelter investment they attracted, and the enabling conditions of market power, coordinated infrastructure investment, and active facilitation of foreign processing capacity (Hendrix 2019).

Yet the Indonesian experience has carried significant costs that advocates of replication tend to understate. Environmental damage from rapid smelter construction—much of it using coal-fired captive power plants—has been severe. Labour conditions in some Chinese-operated smelters have drawn criticism, including reports of worker fatalities. Indonesia's World Trade Organisation compliance has been challenged by the European Union, which filed a dispute that Indonesia lost in 2022, though it has appealed (WTO Dispute DS592). And the downstream industries that were supposed to follow smelting—battery cell manufacturing, electric vehicle assembly—have been slower to materialise than projected. Export bans can work, but they involve trade-offs (environmental, diplomatic, and temporal) that policymakers must weigh honestly.

### Reform Tiers: Achievable and Transformative

Policy analysis is most useful when it distinguishes between the difficult and the nearly impossible. The following two-tier framework is offered as a pedagogical device—a way of organising thinking about mining reform—rather than an advocacy agenda. Reasonable analysts will disagree about where particular reforms belong, and the boundary between the tiers is itself historically contingent. Norway's sovereign wealth fund, to repeat the earlier point, was a Tier 2 idea in the 1970s. It is now the defining Tier 1 example.

**Tier 1—The Achievable Agenda.** These reforms operate within existing institutional frameworks, require no constitutional changes, and have precedent either domestically or in comparable jurisdictions.

*A sovereign wealth fund from mining revenues.* Even at modest scale—say, ring-fencing 20% of mineral royalty revenue, which would currently yield roughly R3 billion annually—a dedicated fund would establish the institutional framework for intergenerational savings (National Treasury 2026). Botswana and Norway provide operational templates. The political obstacle is opportunity cost: every rand saved is a rand not spent on current service delivery. But spending non-renewable resource revenues on current consumption is itself a form of intergenerational injustice—disposing of wealth that belongs partly to future South Africans (Hartwick 1977).

*Streamlined mining licence processing.* The DMPR's licensing backlog is a self-inflicted wound. Applications routinely take years to process, with some pending for over a decade (Minerals Council South Africa 2023; Botha 2026). The Auditor-General has flagged the backlog repeatedly as a governance failure. The fix—additional staff, digital processing systems, statutory time limits with deemed approval—requires no new legislation, only political will and modest budget. Western Australia and Ontario process comparable applications within months (Fraser Institute 2024).

*A critical minerals strategy aligned with the Just Energy Transition.* South Africa needs a coherent policy document—comparable to the EU Critical Raw Materials Act or the US Inflation Reduction Act's mineral provisions—that identifies strategic minerals, streamlines their permitting, and links extraction to domestic manufacturing objectives (IEA 2023). The JETP provides a framework, and international partners have signalled willingness to support critical mineral development as part of the transition package. What is missing is inter-departmental buy-in from the DMPR, the dtic, the Department of Science and Innovation, and National Treasury.

*Mining Charter stability commitment.* A legislated or negotiated moratorium on Mining Charter revisions—say, ten years—would give investors the regulatory predictability they demand without abandoning transformation objectives. Current Charter targets would remain in force; companies would have a defined horizon against which to plan investments and empowerment transactions. The Minerals Council has proposed something similar; the DMPR has been reluctant, preferring to retain discretion. A binding commitment would sacrifice flexibility but gain credibility—and given the collapse in exploration investment, the balance probably favours stability.

*Formalisation pathway for artisanal miners.* Drawing on Ghana's small-scale mining licensing programme and Colombia's formalisation initiatives, South Africa could establish a legal framework for artisanal mining on abandoned or marginal deposits (World Bank 2019). This would mean defining eligible sites, setting safety and environmental standards (necessarily less stringent than for formal mining but sufficient to reduce fatalities), creating a simplified licensing process, and providing technical assistance. Stilfontein demonstrated that treating artisanal mining purely as a law enforcement problem costs lives without solving the underlying economic drivers.

**Tier 2—The Transformative Agenda.** These reforms would require fundamental changes to existing frameworks, face significant political opposition, and carry substantial implementation risks. They are included not as recommendations but as analytical reference points—the outer boundary of what has been proposed.

*Strategic nationalisation of critical mineral deposits.* The EFF has called for nationalisation of mines since the party's founding, and the idea retains substantial popular support (De Kadt, Johnson-Kanu, and Sands 2024). A more targeted version—state acquisition of equity stakes in PGM and manganese operations, modelled on Chile's lithium approach—would be less disruptive than wholesale nationalisation but would still require enormous capital outlays, raise sovereign risk premiums, and demand management capacity that the DMPR has not demonstrated. Many countries own mineral assets successfully. The question is whether the South African state currently *can* manage them competently. Existing evidence is not encouraging: the AEMFC has failed to develop commercially viable operations despite being mandated to secure the state's coal interests, while Alexkor—the state diamond miner on the West Coast—has been operationally moribund for years, requiring repeated bailouts and producing negligible revenue. These cases suggest that the state capacity constraint on mineral asset management is not hypothetical but observable in current institutional performance.

*Indonesian-style export ban to force beneficiation.* Restricting raw mineral exports to promote domestic processing would face obstacles beyond those documented in the Indonesian case. South Africa's minerals are more diversified than Indonesia's nickel, so the market power required for a ban to attract processing investment varies by commodity. WTO compliance is uncertain. And the infrastructure preconditions—reliable electricity, efficient logistics—are precisely the areas where South Africa currently falls short. An export ban without the enabling conditions risks mining contraction without processing expansion.

*Resource-to-cash direct dividend payments.* The Alaska Permanent Fund model—which distributes annual dividends from oil revenues directly to all residents—has attracted interest from development economists as a mechanism for converting resource wealth into broad-based welfare (Moss 2011). Applied to South Africa, a mining revenue dividend would bypass the capacity constraints of state service delivery, putting cash directly into the hands of citizens. The amounts would be modest—current mineral royalties of approximately R16 billion, divided among 63 million people, would yield roughly R250 per person annually—but the principle of direct citizen ownership of mineral wealth has political and philosophical appeal. The practical obstacles are considerable: establishing a distribution mechanism, managing expectations, and accepting the implied reduction in revenue for other purposes.

*Community ownership of sub-surface rights.* The most radical proposal would vest mineral rights not in the national state (as the MPRDA currently provides) but in the communities on whose land deposits are located—effectively reversing the colonial-era expropriation of mineral rights from surface landowners (Claassens and Cousins 2008; High Level Panel 2017). Advocates argue that community ownership would ensure that the costs and benefits of extraction are borne and received by the same people. Critics respond that fragmented mineral rights would make investment impossible, that "community" is a contested concept prone to elite capture, and that national ownership of mineral resources is a well-established legal principle in virtually all mining jurisdictions. This debate will not be resolved soon, but it goes to the deepest tension in South African mineral governance: who, ultimately, owns the wealth beneath the ground?

### Evidence from Parliamentary Oversight

The pattern of institutional futility that Chapter 3 documents in the Budgetary Review and Recommendation Report (BRRR) process—the same failures flagged year after year without resolution, revealing inability rather than ignorance—is fully visible in mining. The Portfolio Committee on Mineral Resources and Energy has flagged the licensing backlog at the DMRE (now the DMPR) in every BRRR since at least 2015, alongside inadequate Social and Labour Plan monitoring, insufficient enforcement against illegal mining (calls for inter-departmental coordination that Stilfontein showed had gone unheeded), and the persistent gulf between beneficiation rhetoric and measurable progress, as the committee's BRRRs from 2019 to 2024 record. The mining committee's record adds one sector-specific twist: its dual mandate of promoting investment (requiring regulatory predictability) and advancing transformation (requiring active intervention) produces recommendations that pull in different directions—reproducing, at committee level, the unresolved tension that characterises the sector as a whole. Chapter 3 provides the fuller treatment of what parliamentary oversight can and cannot achieve under constrained state capacity.

### Bridging the Gap

The distance between Tier 1 and Tier 2 is not just a matter of political ambition. It is a function of state capacity—the very capacity whose weakness is documented throughout this textbook. South Africa is not Norway, with its compact population and world-class public administration. It is not Botswana, with its manageable scale and institutional continuity. It is a complex, unequal, middle-income country with a state apparatus that struggles to process mining licences in a timely fashion, let alone manage strategic mineral investments or administer citizen dividends.

None of this is an argument for resignation. The Tier 1 reforms—a modest sovereign wealth fund, licence processing reform, a critical minerals strategy, Charter stability, artisanal mining formalisation—are all within reach given determined leadership and modest institutional investment. Together, they would substantially improve the mining investment environment, begin building intergenerational savings from non-renewable resources, and address the humanitarian crisis in illegal mining. They would also create the institutional foundations—administrative competence, policy credibility, a track record of implementation—on which more ambitious reforms could eventually rest.

Resource governance, globally, has been a history of incrementalism occasionally punctuated by bold leaps. Norway saved before it established its fund; Botswana built institutions before it negotiated its partnership; Chile maintained an open investment regime for decades before moving towards strategic nationalisation. The path to transformative reform runs through the achievable agenda, a sequence that South Africa's impatient policy discourse too often reverses.

### Binding Constraints Connection

Mining sits at the intersection of multiple binding constraints. The sector is both cause and casualty of the **energy crisis**: coal mining feeds Eskom's power stations while the entire industry depends on reliable electricity for ventilation, hoisting, and processing—load shedding forced production stoppages that cost the sector billions during 2022-2023; cuts were suspended through most of 2024 before load shedding ended entirely by mid-2025 (Chapter 3). The **logistics breakdown** is acutely felt: mining exports depend on Transnet's rail lines and the Richards Bay Coal Terminal, Saldanha for iron ore, and Durban for containerised minerals—all of which have deteriorated (Chapter 3). **State capacity** failures manifest in slow mining licence processing, regulatory uncertainty, and the unresolved tension between the MPRDA and investor confidence. **Human capital deficits** (Chapter 9) limit the sector's modernisation—automated mining requires technical skills that the education system does not produce at sufficient scale. **Labour market dysfunction** (Chapter 8) is visible in the adversarial industrial relations exemplified by Marikana. And the **investment collapse** is particularly severe in mining, where exploration spending has fallen sharply since the early 2010s.

***

## VIII. Conclusion: Repositioning Mining for the Future

Mining remains central even as its relative weight has declined (Statistics South Africa 2023). The sector must manage gold decline and coal transition while developing opportunities in PGMs, manganese, and other green minerals (Minerals Council South Africa 2023). This requires progress on core constraints: energy reliability, logistics, skills, and regulatory certainty (World Bank 2018b).

The MEC legacy shapes both risk and opportunity (Fine and Rustomjee 1996). Entrenched mining-energy linkages make decarbonisation disruptive, especially in regionally concentrated mining economies (PCC 2022). But the same endowment can support the green transition if policy frameworks are credible and implementable (IEA 2023).

Key policy imperatives include:

**Regulatory stability:** Mining investment requires long-term certainty (CDE 2014). The oscillation between different Mining Charter versions, uncertainty over beneficiation requirements and export restrictions, and disputes over mineral rights have deterred investment (Capps 2012). Stable, predictable rules—even if imperfect—are preferable to continuous policy revision.

**Infrastructure investment:** The logistics constraints documented in Chapter 3 bind particularly tightly on bulk commodities (Transnet 2024). Rail capacity for coal and iron ore exports has constrained production; port inefficiency adds costs. The energy transition in Chapter 3 is equally essential—without reliable electricity at competitive prices, neither mining nor beneficiation can thrive.

**Realistic expectations for beneficiation:** Blanket beneficiation requirements make little sense given different competitive positions across minerals. More fundamentally, beneficiation should not be treated as a development panacea. Even successful processing industries will be capital-intensive and employ relatively few workers. Policy attention might be more productively directed towards services productivity, human capital development, and sectors with greater employment potential (Rodrik 2016).

**Just transition planning and funding:** The coal transition is coming regardless of policy choices (IEA 2023). Planning ahead—identifying affected communities, investing in alternatives, providing worker support—can reduce adjustment costs (PCC 2022). The JETP provides significant external financing, but domestic commitment and institutional capacity will determine whether these resources produce genuine transition or are dissipated (Burton et al. 2018).

***

{% hint style="success" %}
**Key Takeaways**

1. The Minerals-Energy Complex (MEC)—the historically entrenched system linking mining, cheap coal-fired electricity, and capital-intensive processing—has fundamentally shaped South Africa's industrial structure, creating path dependencies that persist today.
2. Mining remains economically significant (roughly 6% of GDP, 40%+ of exports, 475,000 direct jobs) but has declined from its historical dominance, with gold production collapsing by over 90% since 1970 while PGMs and iron ore have shown greater resilience.
3. Beneficiation as a development strategy faces fundamental limitations: modern processing is capital-intensive with limited job creation potential, and South Africa lacks competitive advantages in energy costs, logistics, and skills that would make domestic processing viable.
4. Mining carries substantial environmental and social costs, including acid mine drainage requiring billions in ongoing remediation, the migrant labour legacy's continuing social effects, and the growing crisis of informal mining (zama-zamas) in abandoned operations.
5. The just transition in coal-dependent Mpumalanga represents one of South Africa's most significant economic challenges, requiring proactive planning, worker support, and regional economic diversification as coal demand declines due to global decarbonisation.
   {% endhint %}

## Discussion Questions

1. **The MEC Legacy:** How has the historical entrenchment of the Minerals-Energy Complex shaped South Africa's industrial development trajectory? What would be required to break out of this path dependence?
2. **Beneficiation as Development Strategy:** Is the pursuit of beneficiation an example of anachronistic development thinking? What alternative development paths might better address South Africa's unemployment crisis? How should policymakers weigh the appeal of "value addition" against evidence on job intensity in modern manufacturing?
3. **Just Transition:** What institutional mechanisms could best support workers and communities affected by coal sector decline? How should costs be shared between government, mining companies, and international partners?
4. **Environmental Liabilities:** How should responsibility for mining's environmental legacy—particularly acid mine drainage—be allocated among current mining companies, successor entities, and government? What funding mechanisms could address unfunded rehabilitation liabilities?
5. **Green Minerals Opportunity:** Assess South Africa's positioning to benefit from growing demand for "green minerals" in the energy transition. What policy and infrastructure investments would maximise this opportunity?

**Exercises**

1. **Mining GDP Share Trends**: Using Stats SA national accounts data, mining contributed roughly 8 percent of GDP in the mid-2000s and roughly 6 percent by 2024 (Figure 5.2). Calculate the absolute change in mining's real value added (in constant 2015 rand) over this period, given that total real GDP grew from approximately R3.1 trillion (2005) to approximately R4.3 trillion (2024) at constant 2015 prices—both figures approximate. Did mining's real output decline, or did it simply grow more slowly than other sectors? What does this distinction imply for policy?
2. **Commodity Price Volatility**: Gold prices rose 91% from 2010 to 2024 (indexed), while platinum fell 39% over the same period. Suppose a mining company's revenue is 60% platinum and 40% gold. Calculate the net change in the company's revenue index over 2010-2024, holding production volumes constant. If operating costs rose 80% over the same period (driven by electricity and labour), assess whether the company remained profitable at the margin. What does this exercise reveal about the risks of commodity dependence?
3. **Beneficiation Cost-Benefit**: The Saldanha steel plant required approximately R6 billion in capital investment and employed roughly 500 workers at peak operation before its 2020 closure. Calculate the capital cost per job created. Compare this to the estimated R50,000-R100,000 capital cost per job in tourism or services sectors. If the same R6 billion had been invested in tourism infrastructure at R75,000 per job, how many jobs could have been created? Discuss the limitations of this simple comparison.
4. **Just Transition Costing**: The coal sector directly employs approximately 90,000 workers nationally, the large majority of them in Mpumalanga, with average annual earnings of R180,000. The JETP pledged $8.5 billion (approximately R160 billion at current exchange rates). If 50% of JETP funds were allocated to worker transition support, calculate the available amount per affected worker. If retraining programmes cost R50,000 per worker and income support covers 80% of previous wages for 2 years, estimate the total cost for all 90,000 workers. Is JETP funding sufficient for worker transition alone, before considering infrastructure investment?

***

## IX. Key Data Visualisations

This chapter incorporates four data visualisations:

1. **Figure 5.1:** Electricity Available for Distribution and Electricity Production Index (2000-2025) — Stats SA P4141 monthly series showing electricity supply peaking around 2007-2008 and declining since: the supply-side constraint on an energy-intensive mining sector.
2. **Figure 5.2:** Mining Sector GDP Share and Employment — Tracks mining's declining but still significant contribution to GDP (\~6%) and employment (475,000 direct jobs).
3. **Figure 5.3:** Gold, Platinum and Coal Production (2010-2024) — Production levels showing gold's 47% fall alongside relative stability in platinum and a coal plateau.
4. **Figure 5.4:** Commodity Price Trends (2010=100, 2010-2024) — Tracks World Bank price indices for gold, platinum, iron ore and coal, illustrating the terms-of-trade volatility facing the sector.

***

## X. Further Reading

**Minerals-Energy Complex and Mining Economics:**

* Chamber of Mines historical reports and data series.
* Fine, B. & Rustomjee, Z. (1996). *The Political Economy of South Africa: From Minerals-Energy Complex to Industrialisation*. Westview Press.
* Minerals Council South Africa. (2023). *Facts and Figures* (Annual Report).

**Mining Regulation and Performance:**

* Haroon Bhorat, Tsungai Kupeta, Lindiwe Martin, and François Steenkamp, "The Coal Labour Market in South Africa and the Just Transition," DPRU Working Paper 202402 (2024) — Evidence on coal employment dynamics and transition challenges.
* Robert Botha, "Understanding South Africa's Mining Slowdown," ERSA Policy Paper 43 (2026) — Documents how the MPRDA and regulatory obstacles have driven the mining sector's structural decline.
* De Kadt, Daniel, Ada Johnson-Kanu, and Melissa L. Sands. "State Violence, Party Formation, and Electoral Accountability: The Political Legacy of the Marikana Massacre." *American Political Science Review* 118(2): 563-583 (2024) — Shows Marikana catalysed the EFF's formation and cost the ANC nine percentage points in nearby communities.
* Benjamin Gasealahwe, Konstantin Makrelov, and Salome Ragavaloo, "Carbon Taxation in South Africa and the Risks of Carbon Border Adjustment Mechanisms," SARB Occasional Bulletin OBEN/24/01 (2024) — Analysis of EU CBAM impacts on South African mining.

**Just Transition and Coal Phase-Down:**

* Burton, J. et al. (2018). *The End of Coal? Planning a Just Transition in South Africa*. IISD.
* Montmasson-Clair, Gaylor. "A Policy Toolbox for Just Transitions." TIPS Working Paper (2021) — Procedural, distributive, and restorative justice framework.
* Montmasson-Clair, Gaylor. "A Tale of Three Transitions: The Pursuit of Just Transitions in South Africa." TIPS Policy Brief (2024) — Distinguishes the electricity, coal, and economy-wide climate transitions as requiring distinct policy instruments.
* Montmasson-Clair, Gaylor, Muhammed Patel, and Peta Wolpe. "People's Voices: Participatory Justice for a Just Transition in South Africa." TIPS (2024) — Community perspectives from coal-dependent municipalities.
* Presidential Climate Commission. (2022). *A Framework for a Just Transition in South Africa*.
* Wills, Nicola. "Just Energy Transition: How Disused Coal Mines Could Become Sites of Job Creation." Econ3x3 (2025) — Proposes repurposing of closed coal mines for employment in agriculture, environmental monitoring, and renewables.
* Winkler, Harald. *Energy Policies for Sustainable Development in South Africa* (2007) and subsequent work — Foundational analysis of South Africa's energy-climate policy options, including carbon-tax revenue recycling (Winkler et al. 2011) and its use to reduce energy poverty (Winkler 2017).

**Environmental Issues:**

* Federation for a Sustainable Environment. Reports on mining environmental impacts.
* Oelofse, S. et al. (2007). *Acid Mine Drainage in South Africa*. CSIR.

**Comparative Cases:**

* De Gregorio, J. & Labbé, F. (2011). *Copper, the Real Exchange Rate, and Macroeconomic Fluctuations in Chile*. Central Bank of Chile.
* Hendrix, C. (2019). "Indonesia's Nickel Ban." *Foreign Policy*.
* International Energy Agency (IEA). (2023). *The Role of Critical Minerals in Clean Energy Transitions*.

***

◀️ [Chapter 4: Agriculture, Land, and Food Security](/textbooks/the-south-african-economy/part-ii-sectors/chapter-4.md)[Chapter 6: Manufacturing, Trade, and Industrial Policy](/textbooks/the-south-african-economy/part-ii-sectors/chapter-6.md) ▶️