> For the complete documentation index, see [llms.txt](https://laurence-wilse-samson.gitbook.io/textbooks/llms.txt). Markdown versions of documentation pages are available by appending `.md` to page URLs; this page is available as [Markdown](https://laurence-wilse-samson.gitbook.io/textbooks/the-south-african-economy/part-iii-people/chapter-8.md).

# Chapter 8: The Labour Market Crisis

{% hint style="info" %}
**Part III: People** — Parts I and II examined the institutional foundations and productive sectors of the South African economy. Part III turns to outcomes for people: their employment prospects (this chapter), the human capital systems that shape their capabilities (Chapter 9), and the distribution of income, wealth, and opportunity (Chapter 10). The sectoral dynamics documented in Part II — deindustrialisation in manufacturing, mining's employment decline, agriculture's dualism, services' uneven growth — translate directly into the labour market crisis analysed here. Understanding the people dimension is essential because economic performance ultimately matters only insofar as it affects human welfare.
{% endhint %}

## Learning Objectives

By the end of this chapter, you should be able to:

1. **Analyse** the scale and characteristics of South Africa's unemployment crisis, including distinctions between official and expanded definitions
2. **Explain** the structural causes of unemployment, including demand-side, supply-side, and institutional factors
3. **Evaluate** the insider-outsider dynamics that shape wage formation and employment access
4. **Assess** the youth unemployment emergency and interventions designed to address it
5. **Discuss** the trade-offs in labour market policy between protection, flexibility, and employment creation

***

## I. Introduction: A Crisis Without Parallel

South Africa has the highest unemployment rate of any major economy—a crisis severe enough to threaten social cohesion, democratic stability, and long-run growth (World Bank 2018; Seekings and Nattrass 2005). In Q4 2025, 7.8 million people were unemployed under the strict definition (31.4%). Under the expanded definition (now reported as the LU3 labour-underutilisation measure), which adds discouraged work-seekers and other available non-searchers, unemployment reached 42.1%—approximately 12.4 million people (Statistics South Africa QLFS 2025).

> **42.1%** — South Africa's expanded unemployment rate (the LU3 labour-underutilisation measure), including discouraged work-seekers. Approximately 12.4 million people are without jobs (Q4 2025).

These are not abstract numbers. They describe millions of people—disproportionately young, black, and female—without stable income or work-based dignity. They describe grant-dependent households and communities where joblessness has become generational.

<figure><img src="/files/oMmY7uk5gWykq5dJAo2C" alt="Dual-axis chart showing unemployment levels and rates from 2008-2024. The official unemployment rate exceeded 25% since 2015 and surpassed 30% after COVID-19. The expanded rate including discouraged workers approaches 42%, representing well over 11 million people."><figcaption><p><strong>Figure 8.1:</strong> The Unemployment Crisis. <em>Source: Statistics South Africa QLFS (data to 2024). The official rate exceeded 25% since 2015, surpassing 30% post-COVID; the expanded rate approaches 42%. By Q4 2025 the official rate stood at 31.4% and the LU3 (expanded) measure at 42.1%.</em></p></figcaption></figure>

This chapter argues that unemployment is structural, not merely cyclical—rooted in apartheid spatial legacies, deep skills mismatch, and labour-market institutions that protect insiders more than outsiders (Banerjee et al. 2008; Kingdon and Knight 2004). Addressing it requires concurrent action on growth, education, hiring barriers, and active labour-market intermediation (National Planning Commission 2012; Centre for Development and Enterprise various years).

***

## II. The Anatomy of the Labour Market

### Measuring the Crisis: Definitions and Statistics

Understanding South Africa's labour market requires careful attention to definitions and measurement (Kingdon and Knight 2004). Statistics South Africa's Quarterly Labour Force Survey (QLFS) provides the primary data source, distinguishing between:

* **Narrow (official) unemployment**: People without work who actively sought employment in the four weeks before the survey and were available to start work within two weeks.
* **Expanded unemployment**: Adds two groups to the strict count: "discouraged work-seekers"—people who want work but have given up actively searching, often because they believe no work is available—and other available non-searchers, who were available to work but did not actively search for other reasons. In the revamped QLFS introduced from Q3 2025, this group (discouraged work-seekers plus other available non-searchers) is termed the "potential labour force", and the expanded rate is reported as the LU3 labour-underutilisation measure.

The gap between strict and expanded measures is revealing. In Q4 2025, 3.7 million people were discouraged work-seekers and a further 0.9 million were other available non-searchers—a shadow labour force of 4.6 million omitted from headline unemployment (Statistics South Africa QLFS 2025; Kingdon and Knight 2004). COVID-19 exposed this fragility: Bassier, Budlender, Zizzamia, and Jain (2023) show a 40 percent collapse in active employment early in the pandemic, with uneven recovery and heavy losses among low-wage informal workers.

Beyond unemployment, participation remains low: 59.3 per cent versus 65-70% in many peers (Statistics South Africa QLFS 2025; ILO 2018). The absorption rate is 40.6%, meaning barely four in ten working-age South Africans are employed.

Successive releases showed only modest relief: through 2025 the official rate fluctuated between 31.4% and 33.2%—rising to 32.9% in Q1 2025 and 33.2% in Q2 2025 before easing to 31.9% in Q3 2025 and 31.4% in Q4 2025—while the expanded measure remained above 42% throughout (Statistics South Africa QLFS 2025). (From Q3 2025, Stats SA's revamped QLFS release replaced the expanded rate with the closely comparable "LU3" labour underutilisation measure, which stood at 42.4% in Q3 2025 and 42.1% in Q4 2025.)

{% hint style="info" %}

#### Worked Example: Reading a QLFS Release

Statistics South Africa publishes the QLFS quarterly (P0211). Here is how to read the key numbers from a typical release, using Q4 2025 data (released 17 February 2026):

**Step 1: Identify the working-age population (WAP).** The WAP (15-64 years) was approximately 42.1 million.

**Step 2: Separate the labour force from the not economically active.**

* Employed: 17.1 million
* Unemployed (strict): 7.8 million
* Labour force (strict) = Employed + Unemployed = 17.1 + 7.8 = **24.9 million**
* Discouraged work-seekers: 3.7 million
* Other available non-searchers (available to work but not searching for other reasons): 0.9 million
* Together these two groups form the **potential labour force**: 3.7 + 0.9 = **4.6 million**
* Other not economically active: 12.5 million

**Step 3: Calculate the key ratios.**

The expanded measure—reported since Q3 2025 as the LU3 labour-underutilisation rate—adds the potential labour force to the unemployed and to the labour force: expanded (LU3) unemployed = 7.8 + 3.7 + 0.9 = **12.4 million**; extended labour force = 24.9 + 4.6 = **29.5 million**.

(The small differences between the calculated and published rates arise because the calculations here use levels rounded to 0.1 million; Stats SA computes the official rates from unrounded data.)

**Key insight**: The absorption rate (40.6%) is the most informative single indicator. It tells you that barely 41 out of every 100 working-age South Africans are employed—far below the 55-65% typical of peer economies. Unlike the unemployment rate, it cannot be artificially lowered by discouraged workers dropping out of the labour force.

**Why the gap between strict and expanded matters**: The 10.7 percentage point gap (31.4% vs 42.1%) represents 4.6 million people—3.7 million discouraged work-seekers plus 0.9 million other available non-searchers—who want work but are not actively looking. Posel and Casale (2003) demonstrate that this gap is not merely definitional: discouraged workers face genuine search barriers—transport costs, information gaps, and spatial distance from job centres—that make active search economically irrational rather than a reflection of low motivation. If job creation improved and these discouraged workers re-entered the labour force, the strict unemployment rate would initially *rise* even as the labour market improved—a paradox that has trapped policymakers into celebrating falling participation rather than rising employment.
{% endhint %}

| Indicator                        | Formula                                                       | Calculation | Result    | Published |
| -------------------------------- | ------------------------------------------------------------- | ----------- | --------- | --------- |
| Official unemployment rate       | Unemployed / Labour force                                     | 7.8 / 24.9  | **31.3%** | 31.4%     |
| Labour force participation rate  | Labour force / WAP                                            | 24.9 / 42.1 | **59.1%** | 59.3%     |
| Absorption rate                  | Employed / WAP                                                | 17.1 / 42.1 | **40.6%** | 40.6%     |
| Expanded (LU3) unemployment rate | (Unemployed + potential labour force) / Extended labour force | 12.4 / 29.5 | **42.0%** | 42.1%     |

### Demographic and Spatial Patterns

Unemployment is highly unequal across race, gender, age, geography, and education. Seekings and Nattrass (2005) describe this as a post-apartheid distributional regime in which labour markets reproduce historical inequality. Leibbrandt, Woolard, Finn, and Argent (2010) show unemployment is the largest single driver of household income inequality.

**By race**: Black African unemployment (35%) far exceeds that of coloured (23%), Indian/Asian (11%), and white (8%) South Africans (Statistics South Africa QLFS 2024). While these gaps have narrowed slightly since 1994, they remain stark and reflect persistent inequalities in education, location, networks, and discrimination (Seekings and Nattrass 2005).

**By gender**: Women face higher unemployment (34%) than men (29%), though this gap is narrower than in many developing countries (Statistics South Africa QLFS 2024; ILO 2018). The gap widens when considering quality of employment, with women more likely to be in informal, part-time, or domestic work (Bhorat and Cassim 2014).

**By age**: Youth unemployment is catastrophic. It stood at around 57% among 15-24 year-olds in Q4 2025—having exceeded 60% in 2024—and at 43.8% for the 15-34 cohort as a whole (Statistics South Africa QLFS 2025). Many unemployed youth have never held formal jobs, and prospects worsen with time out of work (Banerjee et al. 2008).

> **60%+** — Youth unemployment rate among 15-24 year-olds, with over 3 million young people classified as NEET (Not in Employment, Education, or Training).

<figure><img src="/files/55UbbYeriYyY5d6Tn01W" alt="Line chart showing NEET (Not in Employment, Education, or Training) rate for youth aged 15-24 exceeding 35%, representing over 3 million young people disconnected from both work and learning pathways."><figcaption><p><strong>Figure 8.2:</strong> Youth Exclusion. <em>Source: DE-LMIS, Statistics South Africa QLFS. The NEET rate exceeds 35% for ages 15-24, representing over 3 million disconnected youth.</em></p></figcaption></figure>

**By geography**: Urban areas, particularly metropolitan cores, offer more employment opportunities than rural areas and small towns. Yet even within metros, spatial mismatch persists—jobs concentrate in CBDs and suburban business parks while job-seekers live in townships and informal settlements, separated by expensive, time-consuming commutes (Banerjee et al. 2008; World Bank 2018).

**By education**: Education strongly predicts employment outcomes (Van der Berg 2008; Spaull 2013). University graduates face unemployment rates of around 12%, while those with incomplete secondary education exceed 35% (Statistics South Africa QLFS 2024). Yet education is not a guarantee—even among matriculants (high school graduates), unemployment exceeds 30% (Spaull 2015). Part of the explanation is "qualification inflation": as the supply of university and TVET graduates has expanded, degree-holders have begun to displace matriculants from entry-level positions in retail, clerical work, and administrative services that a generation ago required only a school-leaving certificate. The effect is to ratchet up the credential threshold for employment at every level, so that a Matric pass today is a weaker labour market entry ticket than it was in 2005—a dynamic that falls hardest on precisely the most vulnerable work-seekers.

<figure><img src="/files/ZxSNGKsBNfZKIhH4GfJA" alt="Bar chart showing unemployment rates by education level: 35% for no schooling, approximately 30% for matric-only, declining to under 12% for university degree holders, demonstrating the strong education premium in the labour market."><figcaption><p><strong>Figure 8.3:</strong> The Education Premium. <em>Source: Statistics South Africa QLFS. Unemployment falls from 35% (no schooling) to under 12% (degree holders), though 30% of matriculants remain unemployed.</em></p></figcaption></figure>

### The Informal Sector Puzzle

A striking feature of South Africa's labour market is its unusually small informal sector. In many emerging economies, informality absorbs workers excluded from formal jobs. ILO estimates (2018) place informal employment above 50% in Brazil, India, and much of Africa.

In South Africa, informality employs only about 18% of workers—very low given mass unemployment (Statistics South Africa QLFS 2024). Kingdon and Knight (2004) find the unemployed are largely involuntarily excluded rather than voluntarily queuing for formal jobs. Banerjee et al. (2008) similarly show real barriers to informal self-employment, not simple preference for formality.

Why don't the unemployed create informal businesses or find informal work? Several factors suppress informal employment:

* **Regulatory barriers**: Despite exemptions, compliance costs deter micro-enterprise formalisation and create risks for informal operators.
* **Crime**: High crime rates, particularly in townships and informal areas, impose substantial costs on small businesses—theft, protection payments, and customer fears.
* **Spatial constraints**: Apartheid-era spatial planning concentrated populations in residential townships distant from commercial activity, limiting markets for informal goods and services. In Johannesburg, the average township resident lives 25-35 kilometres from the CBD and major industrial areas; in Cape Town, Khayelitsha is 30 kilometres from the city centre (South African Cities Network 2021). This distance imposes transport costs of R1,500-R2,500 per month — a prohibitive burden for micro-enterprises earning margins of a few hundred rand. Informal trading concentrates at transport nodes (taxi ranks, train stations) where foot traffic exists, but competition for these sites is fierce and often controlled by local gatekeepers.
* **Capital constraints**: Starting even a micro-enterprise requires some capital—for inventory, equipment, or a trading site. The unemployed typically lack savings and face prohibitive borrowing costs.
* **Skills and networks**: Successful informal enterprises often require skills and business networks that the long-term unemployed lack.

<figure><img src="/files/YAU2a7k4Sh6vYbWgJKGS" alt="Choropleth map showing expanded unemployment rates by province, ranging from 28% in Western Cape to 52.1% in Eastern Cape, illustrating the spatial dimension of South Africa&#x27;s labour market crisis."><figcaption><p><strong>Figure 8.4:</strong> Labour Market Exclusion by Province. <em>Source: Stats SA QLFS Q4 2024. The near-twofold gap in expanded unemployment between Western Cape (28%) and Eastern Cape (52%) reflects the enduring spatial legacy of apartheid-era economic geography.</em></p></figcaption></figure>

<figure><img src="/files/yY7bXUbhJZZsNfCJbmVr" alt="Bar chart comparing informal sector employment across countries: South Africa at just 18% versus 50-80% in peer emerging markets like Brazil, India, and other African economies, highlighting South Africa&#x27;s unusually small informal sector."><figcaption><p><strong>Figure 8.5:</strong> The Informal Sector Puzzle. <em>Source: ILO, Statistics South Africa QLFS. South Africa's informal sector employs just 18% versus 50-80% in peer emerging markets.</em></p></figcaption></figure>

A further barrier, largely unique to South Africa among its African peers, is the penetration of formal supermarket chains into low-income areas. Unlike cities such as Lagos or Nairobi, where traditional open-air markets remain the dominant retail format, South Africa's "township mall-ification"—the rapid construction of shopping centres anchored by Shoprite, Pick n Pay, and other national chains—creates an unusually high competitive barrier for informal food and goods traders. Spaza shop margins are squeezed by neighbours with bulk purchasing power, cold chains, and point-of-sale technology that informal operators cannot match, compressing the economic space available for survivalist enterprise in ways that have no close parallel elsewhere on the continent (Competition Commission 2019).

The Harvard Growth Lab's diagnostic of South Africa (Hausmann et al. 2023) offers a spatial explanation that integrates these factors. Shah and Sturzenegger (2022) show that South Africa's unusual urban structure—very distant, low-density residential areas inherited from apartheid and reinforced by post-1994 housing policy—produces a double exclusion. High transport costs reduce the net return from formal employment, raising effective reservation wages and pricing low-skilled workers out of formal jobs. Simultaneously, low residential density reduces the foot traffic near people's homes that sustains informal enterprise in other developing countries. At South Africa's income level, international norms predict own-account self-employment of around 20 percent; the actual rate is barely 4 percent (Shah 2022). This gap—16 percentage points of "missing" self-employment—cannot be explained by grants, labour regulation, education levels, or crime alone; the spatial structure of cities is the binding constraint on informality itself.

The finding has direct policy implications: if spatial exclusion is the primary barrier to informal employment, then interventions focused on deregulation or skills training will have limited effect without parallel reforms to urban density, zoning, and transport connectivity. Relaxing floor-area ratios, maximum height restrictions, and parking requirements in city centres—allowing higher density and mixed-use development—would bring more residents closer to economic activity and increase the viability of informal enterprise (Hausmann et al. 2023).

Asmal, Bhorat, Lochmann, Martin, and Shah (2024) provide a comprehensive DPRU profile of this constrained informal sector. The result is that informality often fails to buffer unemployment: workers excluded from formal jobs frequently cannot establish viable alternatives, increasing dependence on grants and family transfers (Kingdon and Knight 2004; Bhorat and Kanbur 2006).

### Foreign Migrants and the Labour Market

Foreign migrants from the region play a complex and contested labour-market role. Estimates suggest 2-4 million foreign nationals, though precision is limited (Statistics South Africa Census 2022). Many work in sectors with shortages or at wage levels many locals avoid, including farm labour, domestic work, construction, and informal retail.

The township spaza economy is increasingly shaped by migrant entrepreneurs (Crush and Tawodzera 2016), many operating on lower margins and longer hours than local competitors. This has contributed to recurring xenophobic backlash, including deadly attacks and business destruction (Landau 2011; Misago 2016).

The economics remain contested. In some sectors migrants fill shortages; in others they compete directly with locals. Effects vary by sector and locality (Crush and Tawodzera 2016). What is clear is that anti-migrant sentiment intensifies when job scarcity is severe, regardless of measured net impacts.

Policy responses have been restrictive. Home Affairs has tightened visa requirements and increased deportations. Some municipalities have attempted to exclude foreign traders from local markets. These approaches address symptoms rather than causes: the fundamental issue is insufficient job creation, not foreign competition (CDE 2010).

### The Platform and Gig Economy

A growing segment of labour market activity occurs through digital platforms that match workers with tasks: Uber and Bolt for transport; SweepSouth for domestic cleaning; Zapper and Yoco merchants; TaskRabbit-style odd-job platforms. This "gig economy" provides income opportunities for some—often youth with smartphones—while raising questions about worker protection.

Gig work has expanded rapidly, especially in metros (ILO 2021). Ride-hailing and delivery platforms now support large numbers of workers. While this is not standard formal employment, it provides income where alternatives are limited.

The model offers flexibility but weak security (Berg and De Stefano 2017). Workers carry key costs while platforms set terms. Earnings are volatile and can fall below effective minimums after expenses. Benefits are largely absent, and legal classification remains contested (CCMA 2020).

For youth unemployment specifically, gig platforms offer relatively accessible entry points. A young person with a driver's licence and access to a car can begin earning with Uber within weeks—far faster than formal job search typically takes. This has made gig work a significant buffer against youth unemployment, even if it doesn't constitute the stable formal employment that policy targets.

The gig economy also highlights technology's dual role in labour markets: creating new income opportunities while potentially undermining traditional employment protections. As platforms expand and evolve, policy frameworks must adapt to ensure that technological change doesn't simply shift risk onto workers while platforms capture gains.

***

## III. Causes of Structural Unemployment

### Demand-Side: Too Few Jobs

At the most basic level, South Africa has too few jobs for those seeking work (Nattrass 2001; Banerjee et al. 2008). Several factors drive this deficit:

**Slow economic growth**: Since 2012, GDP growth has averaged below 2%, often below population growth (Statistics South Africa 2024; World Bank 2018). Without faster expansion, employment cannot absorb labour-force entrants. The broader investment collapse translates directly into weaker job creation.

**Deindustrialisation**: Manufacturing and mining—historically major formal employers of semi-skilled labour—have contracted sharply (Kaplan 2004; Black 2016; Minerals Council South Africa 2023). Labour-intensive sectors exposed to Asian competition were especially affected (Edwards 2021). Equivalent replacement sectors have not emerged at scale.

**Capital intensity**: The sectors that have grown—finance, telecommunications, business services—tend to be capital and skills intensive, generating fewer jobs per unit of output (Nattrass 2001). Technology adoption further substitutes capital for labour. A modern retail distribution centre employs far fewer workers than the shops it replaces.

**Structural change without absorption**: Standard development economics posits that workers released from agriculture and manufacturing find employment in services. In South Africa, this transition has stalled—workers displaced from declining sectors have not been absorbed into growing ones (Banerjee et al. 2008; Seekings and Nattrass 2005).

### Supply-Side: Skills and Spatial Mismatch

Even where jobs exist, unemployed South Africans often cannot fill them due to mismatches in skills, location, and expectations (Banerjee et al. 2008; World Bank 2018).

**Skills mismatch**: Employers report shortages despite mass unemployment (Centre for Development and Enterprise various years). Demand for artisans, technicians, and professionals outstrips supply, while many unemployed workers lack required schooling or experience (DHET various years).

Education-system failures cascade into labour outcomes (Spaull 2013; Van der Berg 2008). Weak early learning, high dropout, and low foundational literacy/numeracy reduce employability even among matriculants (Fleisch 2008; Taylor 2009). TVET expansion has often outpaced quality and labour-market relevance (DHET various years).

**Spatial mismatch**: Apartheid geography still separates many job-seekers from opportunity (Seekings and Nattrass 2005; World Bank 2018). Long, costly commutes can consume a large share of expected entry-level earnings, reducing both job-search intensity and job acceptance (Banerjee et al. 2008). The scale of this mismatch is sharply illustrated by the distinction between former homeland and non-homeland areas: in non-metro areas outside the former homelands, the employment rate hovers around 46 percent—low but not unusual by international standards. Inside the non-metro former homelands, where nearly 30 percent of South Africans live, the employment rate is barely 26 percent, and in rural former homeland areas it falls to 21 percent (Hausmann et al. 2023; Lochmann 2022). Critically, individuals who *leave* the former homelands achieve employment rates comparable to those born elsewhere, indicating that the constraint is place-based rather than person-based—a finding with direct implications for whether policy should focus on moving people to jobs or jobs to people.

This spatial mismatch particularly penalises youth seeking their first jobs. Without resources for repeated job-search trips, they cannot access opportunities even when willing to work (World Bank 2018).

The provision of RDP housing and Free Basic Services in established townships compounds the problem by creating a "location trap." Because these assets are place-bound and non-portable—a household cannot sell its RDP house at market value or transfer its free water and electricity allocation to another municipality—job-seekers are rationally reluctant to move closer to economic hubs where they would face market rents and lose their service entitlements. The social wage, designed to alleviate poverty, thus inadvertently entrenches the spatial mismatch it was never intended to address.

**Reservation wages**: Some analysts argue that South Africa's social grant system raises "reservation wages"—the minimum wage at which the unemployed will accept work—above market-clearing levels (Kingdon and Knight 2004). The evidence here is contested. Grants are too low (R370–R580 monthly for most recipients, April 2026) to provide comfortable alternatives to work, and most grant recipients report willingness to accept available jobs (Leibbrandt et al. 2010). Indeed, Orkin, Woolard, Goldman, and Leibbrandt (2023) find that the SRD grant actually *increased* labour market participation probability by 25 percentage points, challenging the narrative that grants discourage work-seeking. They argue grants should be combined with job-search assistance programmes, and that framing grants versus employment programmes as fiscal competitors is a false dichotomy. The SRD grant's design itself came under judicial scrutiny in January 2025, when the High Court in Pretoria declared several of its implementing regulations—including the online-only application channel and the narrow definition of "income" used in means testing—unconstitutional for unjustifiably excluding eligible applicants, a ruling the government has taken on appeal (Institute for Economic Justice v Minister of Social Development 2025). Nevertheless, the combination of grants and family support may enable some to decline low-wage or undesirable work (Banerjee et al. 2008). Loewald, Makrelov, and Wörgötter (2023) identify four interacting causes of low labour utilisation: weak education outcomes, geographic mismatch, insider-biased wage bargaining, and regulatory complexity.

The most rigorous evidence on this question comes from Ardington, Case, and Hosegood (2009), who use longitudinal data from KwaZulu-Natal to show that old age pensions received by household members actually *increased* the labour supply of working-age adults, who used the income to finance job search—including migration to urban areas. This finding directly contradicts the "dependency" narrative and suggests that social transfers can function as a form of labour market activation rather than a disincentive to work: the binding constraint for many poor South Africans is not willingness but the liquidity to search.

It is also important to distinguish the "psychological" reservation wage—a preference for formal or clean work over manual labour—from the "economic" reservation wage, which is a straightforward arithmetic calculation. If transport to a job costs R1,000 per month and the wage is R4,000, the net return may be less than the combined value of a grant plus avoided childcare costs. Framing this as "zero-profit job search" rather than implying choice or laziness more accurately reflects the structural reality: for many South Africans, the reservation wage is not a behavioural quirk but a spatial tax on poverty that renders low-wage employment economically irrational.

### Institutional Factors: The Labour Relations Architecture

South Africa's labour legislation, developed in the democratic transition to protect workers from exploitation, may inadvertently contribute to unemployment by raising the costs and risks of hiring (Centre for Development and Enterprise various years; Seekings and Nattrass 2005).

**The legislative framework**: The Labour Relations Act (LRA) guarantees rights to organise, bargain collectively, and strike. The Basic Conditions of Employment Act (BCEA) sets minimum standards for working conditions. The Employment Equity Act requires affirmative action. These laws were essential responses to apartheid-era exploitation but create compliance burdens for employers (Hirsch 2005).

**Bargaining councils**: In many sectors, bargaining councils negotiate wage agreements that can be extended to non-parties—including small firms that did not participate in negotiations. Godfrey, Maree, and Theron (2006) document how bargaining council coverage has contracted since the 1990s, with smaller firms increasingly opting out of sectoral agreements—a trend that business groups argue has not gone far enough and that unions view as a threat to collective bargaining's stabilising role. Critics argue these extensions impose unaffordable labour costs on smaller enterprises, deterring formal employment and pushing activity informal (Centre for Development and Enterprise various years). However, recent research suggests more nuanced effects: wage spillovers from collective bargaining operate partly through worker mobility and partly through compression of firm profit margins, with effects that vary across local labour markets (Bassier 2024).

**Dismissal costs**: South African law provides substantial protections against unfair dismissal, requiring procedural fairness and substantive justification. While protecting workers from arbitrary termination, these requirements raise the costs of hiring mistakes, potentially making employers reluctant to hire workers without established track records—particularly affecting first-time job seekers (Banerjee et al. 2008).

**The minimum wage debate**: The NMW (R20/hour in 2019, R28.79 per hour from March 2025, and R30.23 per hour from March 2026, gazetted on 3 February 2026) remains contentious. Critics warned of job losses, especially in low-wage sectors; proponents emphasised poverty reduction. Early DPRU evidence finds limited aggregate employment effects with sectoral heterogeneity (Bhorat, Lilenstein, and Stanwix 2021). Monopsony-focused research suggests moderate minimum wages can raise pay without large job losses where firms hold wage-setting power (Bassier and Budlender 2024a). Bhorat and Kohler (2024a) also find SRD transfers did not discourage job search and may have eased liquidity constraints.

<figure><img src="/files/20X0b0p6QNA22Oqvfgt2" alt="Line chart comparing public versus private sector wage growth since 2008, showing public sector wages growing substantially faster and opening a gap exceeding 20% for comparable positions by 2024."><figcaption><p><strong>Figure 8.6:</strong> The Wage Premium. <em>Source: Statistics South Africa, National Treasury. Public sector wages have grown faster than private since 2008, with a gap now exceeding 20%.</em></p></figcaption></figure>

An important nuance in interpreting the public-sector wage premium is the "composition effect." The state employs a far higher proportion of professionals—teachers, nurses, doctors, police officers, engineers—than the private sector average, where a larger share of employment consists of semi-skilled and unskilled positions in retail, agriculture, and manufacturing. While a like-for-like premium exists when comparing workers with similar qualifications and occupations, a significant portion of the raw 20% gap reflects the higher average education levels of public employees rather than simple overpayment for equivalent tasks. Disentangling composition from genuine overpayment matters for policy: across-the-board wage freezes risk losing the professionals the state can least afford to lose, while targeted restraint on administrative grades would have smaller fiscal but more defensible efficiency effects.

***

## IV. Youth Unemployment: A Generational Emergency

### The NEET Crisis

Youth unemployment is the sharpest edge of the crisis (Statistics South Africa QLFS 2025; World Bank 2018). In Q4 2025, strict unemployment for ages 15-24 stood at around 57%—the highest of any age group—while for the broader 15-34 youth cohort it was 43.8%; roughly a third (34.0%) of the 10.3 million people aged 15-24 were NEET—detached from both work and learning pathways (Statistics South Africa QLFS 2025; DE-LMIS 2024).

{% hint style="warning" %}
**Youth Emergency:** Over 60% of South Africans aged 15-24 are unemployed. More than 3 million young people are NEET—not in employment, education, or training.
{% endhint %}

#### School-to-Work Transition Pathways

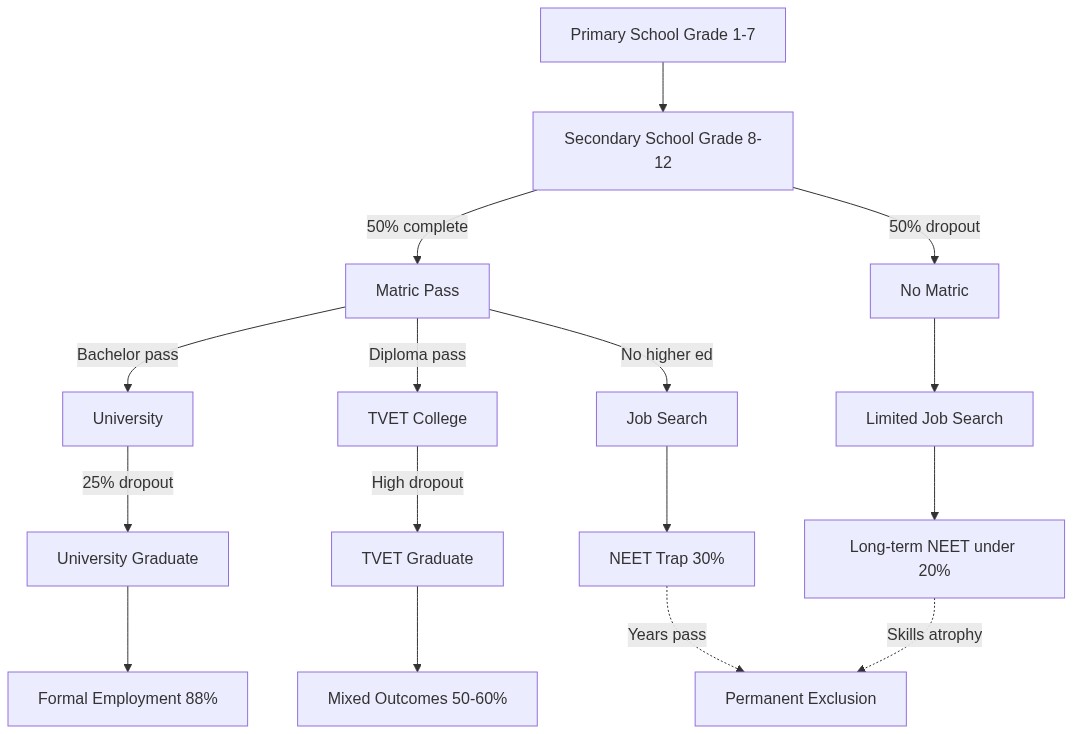
The following diagram illustrates the divergent pathways that young South Africans face as they transition from education to the labour market:

<figure><img src="https://mermaid.ink/img/Zmxvd2NoYXJ0IFRECiAgICBBW1ByaW1hcnkgU2Nob29sIEdyYWRlIDEtN10gLS0+IEJbU2Vjb25kYXJ5IFNjaG9vbCBHcmFkZSA4LTEyXQogICAgQiAtLT58NTAlIGNvbXBsZXRlfCBDW01hdHJpYyBQYXNzXQogICAgQiAtLT58NTAlIGRyb3BvdXR8IERbTm8gTWF0cmljXQogICAgQyAtLT58QmFjaGVsb3IgcGFzc3wgRVtVbml2ZXJzaXR5XQogICAgQyAtLT58RGlwbG9tYSBwYXNzfCBGW1RWRVQgQ29sbGVnZV0KICAgIEMgLS0+fE5vIGhpZ2hlciBlZHwgR1tKb2IgU2VhcmNoXQogICAgRCAtLT4gSFtMaW1pdGVkIEpvYiBTZWFyY2hdCiAgICBFIC0tPnwyNSUgZHJvcG91dHwgSVtVbml2ZXJzaXR5IEdyYWR1YXRlXQogICAgRiAtLT58SGlnaCBkcm9wb3V0fCBKW1RWRVQgR3JhZHVhdGVdCiAgICBJIC0tPiBLW0Zvcm1hbCBFbXBsb3ltZW50IDg4JV0KICAgIEogLS0+IExbTWl4ZWQgT3V0Y29tZXMgNTAtNjAlXQogICAgRyAtLT4gTVtORUVUIFRyYXAgMzAlXQogICAgSCAtLT4gTltMb25nLXRlcm0gTkVFVCB1bmRlciAyMCVdCiAgICBNIC0uLT58WWVhcnMgcGFzc3wgT1tQZXJtYW5lbnQgRXhjbHVzaW9uXQogICAgTiAtLi0+fFNraWxscyBhdHJvcGh5fCBPCg" alt="School-to-Work Transition Pathways"><figcaption><p><em>School-to-work transition pathways showing how educational outcomes determine labour market prospects.</em></p></figcaption></figure>

*The diagram shows how early educational dropout leads to increasingly poor labour market outcomes, with those lacking matric certificates facing the highest risk of permanent exclusion from formal employment.*

The NEET category is especially concerning because it captures youth disconnected from both employment and capability-building pathways (Graham and Mlatsheni 2015). ERSA (2024) finds long-run generational dynamics dominate the post-apartheid unemployment increase, implying youth unemployment may persist into middle age without intervention. SALDRU work shows strong sub-national and gender concentration, especially among young African women (Mudiriza et al. 2023; De Lannoy et al. 2023).

The consequences extend beyond economics. Youth unemployment correlates with poor mental health, substance abuse, and crime (ILO 2018). Young men who cannot find work cannot establish households or fulfil traditional provider roles. Young women may enter exploitative relationships for economic survival. Communities where most youth have never worked cannot transmit workplace norms and expectations to the next generation (Seekings and Nattrass 2005). The NEET phenomenon thus feeds directly into the intergenerational poverty trap analysed in Chapter 10: youth who are NEET in households where the head is also unemployed lack the job-search networks, workplace socialisation, and social capital that Chapter 10 identifies as key drivers of persistent inequality. Without intervention, today's NEET cohort becomes tomorrow's chronically excluded adults, reproducing disadvantage across generations.

### Barriers to First Employment

For young South Africans, obtaining a first job presents distinctive challenges (Banerjee et al. 2008; Graham and Mlatsheni 2015):

**The experience trap**: Employers prefer candidates with experience, but experience requires getting a first job. This catch-22 particularly disadvantages youth from communities with few employed adults who might provide entry points (World Bank 2018).

**Weak networks**: In labour markets everywhere, jobs flow through networks—referrals, recommendations, word-of-mouth about openings (Granovetter 1973). Youth from disadvantaged backgrounds lack connections to employed people who might facilitate access (Seekings and Nattrass 2005).

**Information asymmetries**: Employers cannot easily assess the quality of unfamiliar job candidates, particularly those from schools with no track record. Without signals of capability, they default to easily observable credentials that youth from poor schools cannot provide (Spaull 2015). However, these frictions are not immutable. Carranza, Garlick, Orkin, and Rankin (2022), in a landmark *American Economic Review* article, report on a South African field experiment (with Harambee Youth Employment Accelerator) in which assessing workseekers' skills and helping them credibly share results with firms increased employment by 17 percent and weekly earnings by 34 percent—demonstrating that two-sided information frictions are a significant barrier and that relatively low-cost interventions can meaningfully address them.

**Job-search costs**: Finding work requires transport to potential employers, communication, appropriate clothing, and often unpaid internships or trial periods. Youth without savings or family support cannot afford extended job searches (Banerjee et al. 2008). Compounding this, many jobseekers direct their search inefficiently: Kiss, Garlick, Orkin, and Hensel (2024) report on two South African field experiments showing that many young jobseekers believe they are relatively better at the skill in which they actually score lower. Giving them standardised assessment results redirects their search toward jobs matching their actual comparative advantage—without raising total search effort—and substantially raises earnings.

**Skills deficits**: Many youth leave school without basic workplace readiness—punctuality, professional communication, computer literacy. Even where technical skills match job requirements, these soft skill gaps may disqualify candidates (Centre for Development and Enterprise various years).

### Interventions and Their Limits

Government has launched multiple youth interventions with mixed results (National Planning Commission 2012; World Bank 2018):

**Employment Tax Incentive (ETI)**: Since 2014, ETI has subsidised youth hiring. Evidence suggests modest gains, but deadweight and displacement risks reduce net impact (Rankin 2020). Budlender and Ebrahim (2021) find effects concentrated in small and medium firms, with little detectable impact in large firms despite their larger subsidy capture.

**Youth Employment Service (YES)**: Launched in 2018, YES provides 12-month work experiences for youth in private-sector companies. Participating firms receive B-BBEE recognition in exchange for creating opportunities. YES has placed over 100,000 youth, though concerns persist about placement quality, conversion to permanent employment, and selection of more job-ready candidates (The Presidency various years).

**Presidential Youth Employment Intervention (PYEI)**: This COVID-era initiative consolidated various youth programmes under presidential coordination (The Presidency 2020). Components include digital job-matching through the SA Youth platform, skills programmes, and pathway management for NEET youth. Early results show promise in reaching large numbers, though sustained employment outcomes remain to be demonstrated.

**Public employment programmes**: EPWP and CWP provide temporary/part-time work at scale (National Treasury Budget Review 2024), but generally do not create durable employment pathways (Philip 2013). Even so, PYEI evidence suggests macro-relevant stimulus effects: Bassier and Budlender (2024b) find participant spending rose by about 15 percent, consistent with first-stage multiplier effects.

### Comparative Policy Box: Kenya's Youth Employment Innovations

Kenya faces similar youth unemployment challenges and has pioneered several innovative responses worth examining:

**Ajira Digital Programme**: This government initiative trains young people in digital and online work skills—data entry, virtual assistance, transcription, and content creation. The programme has trained over 50,000 youth and claims to have connected many to online earning opportunities through platforms like Upwork. While scale and sustained earnings remain uncertain, the approach recognises that digital work transcends geographic barriers limiting local employment.

**KCB 2jiajiri**: Kenya Commercial Bank's programme combines enterprise training with access to financing for youth entrepreneurs. Rather than seeking employment, participants create micro-enterprises—a recognition that job creation may need to come from youth themselves. Mentorship, business networks, and patient capital support sustainability.

**M-Kopa and gig platforms**: Private sector innovations have created earning opportunities for youth as agents, distributors, and repair technicians for products from solar systems to mobile phones. These aren't traditional employment but provide income and skills development.

**Lessons for South Africa**: Kenya's approaches emphasise entrepreneurship and digital skills alongside traditional employment-seeking. They leverage mobile technology for training delivery and job matching. While context differs—Kenya's informal sector is larger and barriers to self-employment lower—elements may translate. South Africa's SA Youth platform adopts similar digital job-matching approaches.

***

## V. Labour Relations and Industrial Conflict

### The Institutional Framework

South Africa's labour-relations system reflects the negotiated transition compromise between labour and capital (Hirsch 2005; Marais 2011). The framework institutionalised strong worker protections while preserving a degree of employer flexibility.

Key institutions include:

**Trade unions**: COSATU (Congress of South African Trade Unions) remains the largest federation, though membership has declined from over 2 million to around 1.5 million (ILO 2018). FEDUSA represents largely white-collar workers. SAFTU, formed in 2017 after NUMSA's expulsion from COSATU, represents more militant unionism. Total union density has fallen to around 25% of formal employment—still high by international standards but declining (Statistics South Africa QLFS various years).

**Bargaining councils**: Sector-specific bodies negotiate wages and conditions. Agreements can extend to non-parties in the sector, which critics argue disadvantages small firms (Centre for Development and Enterprise various years). Councils also administer dispute resolution and social benefits.

**NEDLAC**: The National Economic Development and Labour Council brings together government, business, labour, and community constituencies to discuss economic and labour policy. While intended as a social dialogue mechanism, NEDLAC has often become a site of adversarial negotiation rather than genuine consensus-building (Habib 2013).

**CCMA**: The Commission for Conciliation, Mediation and Arbitration handles individual employment disputes—dismissals, unfair labour practices, discrimination complaints. The CCMA resolves millions of cases, providing accessible dispute resolution but potentially increasing employer caution about hiring (CCMA Annual Report various years).

### The Insider-Outsider Divide

A union-centred system creates classic insider-outsider dynamics (Lindbeck and Snower 1988; Seekings and Nattrass 2005). Insiders in formal, often unionised employment receive stronger wage protection, job security, and benefits.

Outsiders—the unemployed, informal workers, and many non-union workers—lack equivalent protection. Some protections may also impose outsider costs through reduced hiring demand, greater hiring risk aversion, and compliance burdens on smaller firms (Banerjee et al. 2008; Centre for Development and Enterprise various years).

Research on firm-level wage determination reveals that firms play a larger role in driving wage inequality in South Africa than in wealthier countries with tighter labour markets (Bassier 2023). Collective bargaining agreements, moreover, shape wages well beyond the firms they formally cover (Bassier 2022)—a spillover finding examined in the Policy Debates and Reform Frontiers section below. With high unemployment giving employers substantial bargaining power, similar workers receive very different wages depending on which firm employs them. This firm-wage premium effect amplifies inequality beyond what individual characteristics alone would predict, and helps explain why women—who tend to sort into lower-paying firms—face larger gender wage gaps over their careers (Bassier and Gautham 2025).

This dynamic creates political economy challenges for reform. Insiders vote, organise, and lobby to protect their position. Outsiders, dispersed and unorganised, struggle to make their interests heard (Seekings and Nattrass 2005). Reforms that might increase employment by reducing protections face fierce resistance from those who would bear the costs, even if aggregate employment might rise.

### Industrial Conflict: Marikana and Its Aftermath

Strike activity in South Africa has historically been higher than in peer economies, occasionally turning violent (ILO 2018). The watershed event was the 2012 Marikana massacre, where police shot dead 34 striking platinum miners—the deadliest use of force by state security since the Soweto uprising in 1976 (Farlam Commission 2015).

Marikana crystallised multiple labour market tensions (Farlam Commission 2015; Capps 2012): inter-union rivalry between NUM (National Union of Mineworkers) and the insurgent AMCU (Association of Mineworkers and Construction Union); worker frustration with wages that seemed inadequate despite mining companies' profits; the militancy that emerges when workers feel traditional channels have failed; and the state's response when order breaks down.

The aftermath reshaped the labour landscape. AMCU grew while NUM declined in platinum mining (Minerals Council South Africa 2023). Strikes became more frequent and prolonged, with platinum and gold sectors experiencing extended stoppages. The social compact between labour, capital, and state—already strained—frayed further (Habib 2013). The political fallout was equally significant: De Kadt, Johnson-Kanu, and Sands (2024) demonstrate that Marikana catalysed the formation of the EFF and cost the ANC approximately nine percentage points in affected communities—evidence that state violence against workers can trigger lasting electoral realignment.

More broadly, protracted strikes and industrial conflict contribute to investment uncertainty, deterring both domestic and foreign capital from labour-intensive activities (World Bank 2018). Companies considering South African operations factor strike risk into location decisions. The mining sector's employment decline accelerated partly because labour relations made operations increasingly difficult (Minerals Council South Africa 2023).

### Comparative Policy Box: Rwanda's Public Works to Private Jobs Pipeline

Rwanda's Vision 2020 Umurenge Programme (VUP) offers an interesting contrast to South Africa's public employment programmes:

**Integrated approach**: VUP combines public works employment with financial literacy training, savings programmes, and links to credit. Participants build assets while working rather than merely receiving temporary income.

**Skills development**: Public works projects are selected partly for skills transferability. Road maintenance teaches construction skills; tree planting develops agricultural knowledge. The programme aims to leave participants more employable than when they started.

**Private sector linkages**: In some districts, VUP works with Special Economic Zones and private employers to create transition pathways. Graduates of public works programmes receive priority for private sector openings. Some have established micro-enterprises serving industrial zones.

**Graduation focus**: VUP explicitly aims to graduate participants out of the programme into sustainable livelihoods. Success is measured not by participation but by exits to other employment or self-employment.

**Lessons for South Africa**: EPWP and CWP provide income but limited pathways to sustainable employment. A more integrated approach—linking public works to skills certification, savings accumulation, and private sector placement—might improve long-term outcomes. This requires coordination across employment, education, and economic development programmes that South Africa's fragmented governance makes difficult.

***

## VI. The Policy Challenge: Competing Approaches

South Africa's labour-market crisis has no single-policy fix. Job scarcity, skills mismatch, spatial barriers, and institutional rigidities interact, so the core debate is about binding priorities and leverage points (National Planning Commission 2012; World Bank 2018).

### The Pro-Growth Camp

The pro-growth camp locates the binding constraint on the demand side: without faster economic growth, job creation will remain inadequate regardless of supply-side or institutional reform (Nattrass 2001; Du Plessis and Smit 2007). Its programme follows directly—raise investment through regulatory certainty, infrastructure reliability, and competitive input costs (National Treasury Budget Review various years); actively support sectors with high employment multipliers such as agriculture, tourism, construction, and personal services (Black 2016; OECD various years); and run monetary and fiscal policy that prioritises growth and employment, accepting somewhat higher inflation if necessary (South African Reserve Bank \[SARB] Monetary Policy Review various years).

### The Reform Camp

The reform camp emphasises institutional constraints that prevent the labour market from clearing even at current growth rates (Centre for Development and Enterprise various years). Its instruments are labour market flexibility—lower dismissal costs, limits on bargaining council extension, youth wage exemptions, streamlined dispute resolution (Banerjee et al. 2008)—alongside minimum wage moderation with geographic or sectoral variation (Magruder 2013), and facilitation of informal self-employment through reduced regulatory barriers, secure trading sites, and access to capital (Kingdon and Knight 2004). Critics warn that flexibility reforms might reduce wages and protections for currently employed workers without generating significant new employment—the "race to the bottom" critique—and international evidence is mixed, with context-specific factors determining outcomes (Seekings and Nattrass 2005; ILO 2018).

### The Skills/Spatial Camp

A third camp emphasises supply-side barriers that prevent workers from filling available vacancies (Spaull 2013; Van der Berg 2008). Its agenda spans education reform—school quality, TVET renewal, and curricula aligned with employer needs (DHET various years; National Planning Commission 2012)—transport subsidies to offset the spatial mismatch between townships and economic centres (World Bank 2018), public employment as a bridge providing income and work experience while longer-term reforms take effect (Philip 2013; National Treasury Budget Review various years), and active labour market policies such as job-matching, training, and wage subsidies (Rankin 2020; ILO 2018).

These camps are not mutually exclusive—most serious proposals draw on all three—but they imply different priorities and sequencing. The Policy Debates and Reform Frontiers section below takes up the contested instruments one by one—the national minimum wage, the Employment Tax Incentive, public employment programmes, bargaining councils, and informality—and weighs the evidence each camp brings to bear.

### Comparative Policy Box: India's National Apprenticeship Scheme

India has recently reformed its apprenticeship system to address youth unemployment and skills gaps:

**Scale expansion**: The National Apprenticeship Promotion Scheme (NAPS) aims to increase apprenticeship positions from under 300,000 to over 5 million. Financial incentives to employers—covering a portion of stipends and basic training costs—encourage participation.

**Employer engagement**: Industrial Training Institutes (ITIs) are required to partner with employers, who help design curricula, provide workplace exposure, and commit to absorbing graduates. Placement rates are now funding metrics for ITIs.

**Flexible structure**: The new Apprentice (Amendment) Act 2014 simplified compliance, reduced minimum apprenticeship duration, and allowed more industries to participate. Small firms can share training obligations.

**Certification recognition**: Apprenticeship completers receive nationally recognised qualifications that signal skills to other employers, increasing labour mobility.

**Lessons for South Africa**: South Africa's apprenticeship system remains small relative to the skills challenge. The key insight is linking training institutions' funding to employer satisfaction and graduate placement—creating accountability for labour market outcomes rather than just training outputs. This requires breaking down boundaries between education and employment policy.

***

## Policy Debates and Reform Frontiers

The preceding sections documented the anatomy of South Africa's labour market crisis, its structural causes, the generational emergency facing youth, and the competing analytical camps that propose different remedies. This section draws those threads together into a closer examination of the specific policy debates now underway, what can be learned from international experience, and what a realistic reform agenda might look like. These are not idle academic exercises. With more than 12 million South Africans without work under the expanded definition (Q4 2025), the policy choices made in the next decade will determine whether the country bends its course toward inclusion or entrenches a permanent underclass.

### The Current Debate

Five policy questions dominate South Africa's labour market debate, each generating a growing empirical literature and sharp disagreements among researchers, government officials, unions, and employers.

**The national minimum wage: floor or ceiling?** The National Minimum Wage, introduced at R20 per hour in 2019, rising to R28.79 per hour from March 2025, and set at R30.23 per hour from 1 March 2026 (a 5 per cent increase gazetted on 3 February 2026, with farm and domestic workers at full parity), remains fiercely contested. Bhorat, Lilenstein, and Stanwix (2021), in the most careful early evaluation from the Development Policy Research Unit (DPRU), find limited overall employment effects but with significant heterogeneity across sectors—agriculture and domestic work, where pre-NMW wages were lowest, showed more vulnerability than services or manufacturing. Bassier (2023) extends this analysis at the firm level, demonstrating that employer market power—monopsony—is pervasive in South Africa's high-unemployment labour market, which means that moderate minimum wage increases can raise wages without necessarily destroying jobs. Firms with monopsony power were already paying below workers' marginal product; the minimum wage compresses that wedge. The Centre for Development and Enterprise (CDE various years), however, has persistently warned that in sectors and regions where labour demand is most elastic—rural agriculture, small-town retail, labour-intensive manufacturing—the NMW risks pricing out precisely the low-skilled workers it aims to protect. Bhorat and Stanwix (2020) document compliance gaps: in sectors like agriculture and domestic work, a significant share of employers simply do not comply, suggesting that the binding wage for many workers is not the statutory minimum but whatever their employer chooses to pay. The live question is therefore not whether to have a minimum wage—that ship has sailed—but how quickly to raise it, whether to allow geographic or sectoral variation, and how to enforce compliance without driving activity underground.

**The Employment Tax Incentive: modest gains, uncomfortable questions.** The ETI, introduced in 2014 as a wage subsidy for employers hiring young workers aged 18-29, has been evaluated with growing sophistication. Budlender and Ebrahim (2021) provide the most careful re-evaluation using administrative tax data, and their findings are sobering: firm-level difference-in-differences estimates are unreliable due to mean reversion in matched control firms, and their partial-identification approach suggests modest youth employment gains at small and medium firms but no detectable effect at large firms—which claim the bulk of the subsidy. This raises awkward questions about deadweight loss: how many subsidised hires would have occurred anyway? Rankin (2020) estimates perhaps 50,000 additional jobs, but at a fiscal cost that might have been deployed more effectively through other channels. There are also displacement concerns—firms substituting subsidised young workers for unsubsidised older ones, shifting the unemployment burden rather than reducing it. Still, the ETI remains one of the few demand-side interventions with any positive evaluation evidence, and its periodic renewal has become a fixture of budget debates.

**Public employment programmes: scale, quality, and permanence.** The Expanded Public Works Programme (EPWP) and Community Works Programme (CWP) together reach roughly 800,000 participants at any given time, providing temporary or part-time employment in maintenance, social services, environmental rehabilitation, and community safety (National Treasury Budget Review various years). Philip (2013) documented the CWP's distinctive design—community-directed, part-time, ongoing rather than project-based—as a more promising model than traditional public works. But evaluations keep flagging the same problems: low wages (typically R100-150 per day), limited skills transfer, and negligible transition rates into permanent employment. The programmes provide income, which matters enormously to participants, but they do not build routes out of poverty.

The Institute for Economic Justice (IEJ 2021) has proposed scaling public employment dramatically—to 2 million or more participants—arguing that the state should function as employer of last resort at minimum wage. This proposal, drawing on the international job guarantee literature and given political momentum by the Presidential Youth Employment Initiative's rapid scaling during COVID-19, would be the most significant expansion of state employment contemplated since the end of apartheid. Bassier and Budlender (2024b), matching PYEI participant IDs with retailer sales data, find a sharp 15 percent increase in participant spending—evidence that public employment generates genuine demand-side stimulus beyond the direct wage payment. Whether a programme designed for emergency pandemic response can be institutionalised at scale—without the quality erosion, corruption, and patronage capture that have afflicted public employment schemes elsewhere—remains an open question.

**Labour market flexibility versus protection: the perennial tension.** The debate over bargaining council agreements, dismissal costs, and regulatory burden has been running since the democratic transition, and the positions have hardened. The CDE (various years) has argued consistently that extending bargaining council agreements to non-parties—particularly small firms that were not represented in negotiations—imposes unaffordable labour costs on enterprises least able to bear them, suppressing formal employment and pushing activity into the shadows. COSATU and allied unions counter that weakening collective bargaining would erode wages without generating significant employment, that employers rather than the unemployed would be the main beneficiaries, and that the experience of countries that pursued aggressive deregulation (the United Kingdom under Thatcher, post-crisis Greece) shows that flexibility does not automatically translate into job creation (Seekings and Nattrass 2005). Bassier (2022), using matched employer-employee tax data merged with bargaining council agreements, adds empirical nuance: collective bargaining not only raises wages in covered firms but generates sizeable spillovers to connected non-covered firms through interfirm worker flows, with a cross-wage elasticity of approximately 0.8. This means the distributional effects of collective bargaining are roughly double what conventional estimates suggest—bargaining councils shape wages across the economy, not just within covered sectors. Reforming or weakening them would have broader and less predictable effects than either camp typically acknowledges.

**The informal economy: suppressed, not absent.** South Africa's informal sector employs just 18 percent of the workforce, against 50-80 percent in peer developing economies—a puzzle that Kingdon and Knight (2004) read as evidence that the unemployed face genuine barriers to self-employment rather than voluntarily queuing for formal work. Asmal, Bhorat, Lochmann, Martin, and Shah (2024), in the first comprehensive DPRU empirical profile of the informal sector, document its characteristics: predominantly survivalist, concentrated in retail trade, with low capital intensity, limited access to credit, and high exposure to crime and municipal harassment. The question for policy is whether to treat informality as a problem to be formalised or a livelihood to be supported. The dominant regulatory approach has leaned toward the former—registration requirements, health standards, zoning enforcement—which in practice often amounts to harassment of people trying to survive. A growing chorus of researchers and civil society organisations argues for the latter: providing infrastructure (market stalls, water, electricity), extending social protection to informal workers, and removing regulatory barriers that prevent micro-enterprises from operating legally without imposing compliance costs designed for large firms.

### International Lessons

South Africa is not the first country to confront mass unemployment, and its policymakers need not design solutions from scratch. Four international comparators offer relevant lessons, though none transfers cleanly.

**Nordic "flexicurity": the gold standard that requires gold.** Denmark and Sweden built labour market systems combining flexible hiring and firing rules with generous unemployment insurance and intensive active labour market policies—a triangle that Danish researchers termed "flexicurity" (Madsen 2004). Employers can adjust their workforce rapidly in response to changing conditions, reducing the risk premium that makes them reluctant to hire. Workers who lose jobs receive substantial income replacement (up to 80-90 percent of previous earnings in Denmark) for extended periods, cushioning the blow. Active labour market policies—job-search assistance, retraining programmes, subsidised employment—help displaced workers find new positions quickly. During the model's golden years from the 1990s through the mid-2000s, the result was unemployment rates below 5 percent despite rapid structural change (Andersen and Svarer 2007).

The appeal for South Africa is obvious: flexicurity promises to square the CDE's call for flexibility with COSATU's demand for protection. But the preconditions are daunting. The Nordic model rests on fiscal capacity South Africa simply lacks—Denmark spends roughly 2 percent of GDP on active labour market policies alone, a figure that would consume a substantial share of South Africa's discretionary budget. It requires high social trust: trust that employers will not abuse flexibility, that the state will deliver on its insurance and retraining commitments, that workers will engage genuinely with job-search requirements. And it presumes a labour market where unemployment is frictional rather than structural—where workers losing jobs have skills that other employers want. In South Africa, where unemployment is overwhelmingly structural and the state's capacity to deliver services is compromised, transplanting the Nordic model wholesale would be quixotic. Elements, though, are transferable: the principle that flexibility for employers should be paired with genuine security for workers, and that active labour market policies are not a luxury but a necessary complement to any regulatory framework.

**Argentina's Jefes de Hogar: job guarantee under crisis conditions.** During Argentina's catastrophic 2001-02 economic crisis—when GDP contracted by nearly 11 percent and unemployment exceeded 20 percent—the government introduced the Jefes y Jefas de Hogar Desocupados programme, a near-universal job guarantee for unemployed household heads (Tcherneva and Wray 2005). At its peak, Jefes enrolled approximately 2 million participants, roughly 5 percent of the population, who received a modest stipend in exchange for work in community projects, training, or micro-enterprise activity. The programme was deployed rapidly, reaching massive scale within months—a demonstration that states can act as employer of last resort when political will exists.

The lessons for South Africa are mixed. Jefes demonstrated that large-scale public employment can be implemented quickly, that community-based work allocation can function, and that even modest income support ($150 per month at the time) has significant welfare effects for desperately poor households. But the programme suffered from quality problems: many "work" assignments were make-work, supervision was weak, and allegations of political patronage in participant selection were widespread (Galasso and Ravallion 2004). As the Argentine economy recovered, the programme was gradually wound down rather than institutionalised—suggesting that its political support depended on the emergency rather than being embedded as a permanent feature of the social contract. For South Africa, where the crisis is permanent rather than cyclical, the question is whether a Jefes-style programme could be sustained over decades rather than years.

**Germany's Kurzarbeit: preserving jobs through downturns.** Germany's short-time work scheme—Kurzarbeit—allows firms facing temporary demand reductions to cut workers' hours rather than laying them off, with the government compensating workers for a portion of lost earnings (Cahuc 2019). The scheme drew global attention during the 2008-09 financial crisis, when it preserved an estimated 2.2 million jobs, and was deployed again at massive scale during COVID-19, reaching 6 million workers at its peak in April 2020. The logic is straightforward: retaining workers during temporary downturns avoids destroying firm-specific human capital and prevents the hysteresis effects that turn temporary layoffs into permanent unemployment.

South Africa introduced a version of this concept through the Temporary Employer-Employee Relief Scheme (TERS) during COVID-19 lockdowns, and Kohler, Bhorat, and Hill (2023) evaluate its effects on job retention. Kurzarbeit's relevance to South Africa's structural unemployment is limited—it is designed for cyclical downturns, not for an economy that chronically fails to generate enough jobs. But its design principle, that preventing job destruction is cheaper than creating new employment, applies in sectors experiencing temporary shocks: the just energy transition's impact on coal communities (Chapter 5) or drought effects on agriculture (Chapter 4).

**India's MGNREGA: employment guarantee at unprecedented scale.** The Mahatma Gandhi National Rural Employment Guarantee Act (2005) guarantees every rural household 100 days of unskilled manual work per year at the minimum wage, making it the largest public employment programme in human history (Dreze and Khera 2009). In a typical year, MGNREGA provides employment to 50-70 million households. It has been credited with reducing rural poverty, bringing women into paid work (they constitute roughly half of participants), creating durable community assets (roads, irrigation, watershed management), and raising rural wages by tightening local labour markets (Imbert and Papp 2015).

The programme's problems are equally well documented. Corruption is endemic: ghost workers on payrolls, inflated materials costs, officials demanding kickbacks from participants (Niehaus and Sukhtankar 2013). Payment delays—sometimes stretching to months—undermine the programme's function as reliable income support. Asset quality varies enormously across states; some create genuinely useful infrastructure while others produce poorly built structures that collapse within years. Administrative capacity determines outcomes: states like Kerala and Rajasthan, with stronger local governance, achieve far better results than Bihar and Uttar Pradesh.

For South Africa, MGNREGA's scale is the key lesson. A country with more than 12 million unemployed people under the expanded definition needs interventions that reach millions, not thousands. South Africa's EPWP and CWP, reaching approximately 800,000 participants, operate at roughly one-tenth of the scale that the crisis demands. MGNREGA shows that employment guarantees can function at massive scale—but also that scale without administrative capacity produces waste and corruption. South Africa's own struggles with EPWP quality suggest that scaling up would require simultaneous investment in programme management, monitoring, and accountability systems.

### Reform Tiers: Achievable and Transformative

The policy debates and international lessons converge on a central tension: the gap between what is technically desirable and what is politically and administratively feasible. The following two-tier framework is offered not as advocacy but as an analytical device. Tier 1 comprises interventions that build on existing programmes and institutions, face manageable political opposition, and could be implemented within current fiscal and administrative capacity. Tier 2 comprises interventions that would require significant new institutions, fiscal commitments, or political realignments—transformative in ambition, uncertain in feasibility.

**Tier 1 — The Achievable Agenda**

*Make the ETI permanent and retarget it.* The Employment Tax Incentive has been renewed repeatedly on a temporary basis, creating uncertainty for employers considering whether to build hiring practices around it. Making the subsidy permanent—while adjusting its design in light of Budlender and Ebrahim's (2021) finding that large firms capture the bulk of the subsidy without demonstrable employment effects—would provide a stable demand-side incentive. Directing the subsidy more aggressively toward small and medium firms, where employment effects appear genuine, would improve cost-effectiveness.

*Scale public employment to 2 million participants.* The PYEI showed during COVID-19 that rapid scaling of public employment is administratively feasible and generates measurable economic stimulus (Bassier and Budlender 2024b). Moving from 800,000 to 2 million participants would require roughly R40-50 billion annually—significant but not impossible within a R2.2 trillion expenditure framework, particularly if offset by reduced social grant expenditure as participants earn wages rather than receiving transfers. The CWP's community-directed model (Philip 2013) provides a design template that is more sustainable than traditional project-based public works.

*Streamline small business registration.* South Africa ranks poorly on ease of starting a business in international comparisons, with registration processes scattered across multiple agencies—CIPC for company registration, SARS for tax, UIF for unemployment insurance, COIDA for workers' compensation, municipal licensing for trading permits. A genuine one-stop shop—digital, integrated, functional within days rather than weeks—would reduce the compliance burden that deters formalisation and pushes micro-enterprises into informality.

*Reform bargaining council extension to exempt micro-enterprises.* The Labour Relations Act already allows exemptions from extended agreements, but the application process is cumbersome, opaque, and frequently denied. A blanket exemption for firms below a defined size threshold—say, 10 employees—would remove one barrier to formal employment in micro-enterprises without threatening the bargaining council system's coverage of larger firms where it operates most effectively.

*Expand the Youth Employment Service with better employer incentives.* YES has placed over 100,000 youth in 12-month work experiences, but conversion rates to permanent employment remain low and there are concerns about selection bias toward more job-ready candidates. Tightening the programme's incentive structure—linking B-BBEE recognition to post-placement outcomes rather than just placement numbers, providing support (mentoring, skills development, transport subsidies) to make placements stick—could improve its long-term impact.

**Tier 2 — The Transformative Agenda**

*A job guarantee: the state as employer of last resort.* The most ambitious proposal in South Africa's labour market debate is a formal job guarantee—a legal right to employment at the national minimum wage for any person willing and able to work. The IEJ (2021) has developed the most detailed South African proposal, drawing on the international job guarantee literature influenced by Modern Monetary Theory (Tcherneva 2020) and informed by Argentina's Jefes experience and India's MGNREGA. The idea, once considered fringe, gained mainstream traction globally after COVID-19 demonstrated that states could mobilise fiscal resources and employment capacity at scales previously considered impossible. South Africa's own PYEI, which created over 2 million job opportunities with a R42 billion budget by 2024, constitutes a practical demonstration that large-scale public employment is administratively feasible.

The obstacles are formidable. Fiscal cost estimates for a full job guarantee range from R100-200 billion annually, depending on take-up assumptions—a sum that would require either significant tax increases, expenditure reallocation, or tolerance for larger fiscal deficits. The administrative capacity to manage millions of work placements, ensure productive activity, prevent corruption, and maintain quality would need to be built essentially from scratch. The political economy is tangled: organised labour is ambivalent (a job guarantee at minimum wage could undermine bargaining power by providing an alternative to striking), business is sceptical (fearing competition for workers and upward wage pressure), and Treasury is hostile (on fiscal sustainability grounds). Yet the sheer scale of South Africa's unemployment crisis—worse than anything the Nordic countries, Germany, or even Argentina confronted—may ultimately demand interventions of commensurate ambition.

*A four-day work week pilot.* Work-sharing—distributing available employment across more workers by reducing individual hours—is an old idea that has gained renewed attention as countries from Iceland to the United Kingdom have conducted successful trials. A pilot programme in South Africa, perhaps in the public sector or in partnership with willing private firms, could test whether reduced working hours with maintained pay levels lead to increased hiring, improved productivity, and better worker wellbeing. International trial evidence is encouraging on productivity and wellbeing; the employment-creation effects are less clear, particularly where the binding constraint is total labour demand rather than its distribution.

*Radical informality support.* Rather than treating the informal sector as a regulatory problem to be formalised, a different approach would recognise informal work as the norm for millions of South Africans and design public policy accordingly. This would mean providing market infrastructure (covered trading stalls, storage, water, sanitation, electricity connections) as a standard municipal service; extending social protection (health insurance, accident cover, pension contributions) to informal workers through simplified registration and subsidised premiums; removing by-laws and licensing requirements that criminalise survivalist enterprise; and integrating informal traders into urban planning rather than marginalising them to peripheral locations. Asmal et al. (2024) document the characteristics that such policy would need to address; Kingdon and Knight's (2004) findings confirm that the informal sector's smallness reflects barriers, not preferences.

*Sectoral wage subsidies funded by payroll levies on capital-intensive firms.* This proposal—taxing firms that employ few workers relative to their output and using the revenue to subsidise labour-intensive employment—would force firms to internalise the social cost of capital-intensive production choices. It would create incentives for firms to adopt more labour-absorbing technologies and business models, while generating revenue to reduce the cost of hiring in labour-intensive sectors. The design challenges are real: defining capital intensity, avoiding perverse incentives, managing the administrative burden of a new levy. But the underlying logic—that South Africa's factor price structure, shaped by subsidised capital and expensive labour, systematically discourages employment—deserves serious attention.

*Universal basic services to lower the cost of job search.* Transport, mobile data, and childcare are the three costs that most effectively exclude poor South Africans from the labour market. A young woman in Khayelitsha who must spend R1,500 monthly on minibus taxis, R200 on mobile data to search job listings, and arrange informal childcare to attend interviews faces barriers that no amount of "skills development" can overcome. Subsidised or free public transport for job-seekers, zero-rated mobile data for employment platforms, and publicly funded early childhood development centres in low-income communities would lower the cost of labour market participation and expand the effective labour supply. These are not labour market policies in the conventional sense, but they may do more to connect work-seekers with opportunities than any number of SETA-accredited training programmes.

The two-tier reform framework should be read not as a policy menu from which enlightened technocrats can select, but as a map of the ground where institutional capacity, political interests, and fiscal constraints determine what is possible. Tier 1 interventions are achievable precisely because they work within existing institutional structures, however imperfect. Tier 2 interventions are transformative precisely because they require building new ones. The history of South African labour market policy suggests that Tier 1 progress is possible if fitful, while Tier 2 ambitions will require the kind of political realignment and institutional renewal that occurs rarely—perhaps once in a generation.

The job guarantee idea warrants particular attention as a pedagogical matter, not because its adoption is imminent but because it clarifies the stakes. If the state is unwilling to act as employer of last resort, then it is implicitly accepting that 8-12 million people will remain without work indefinitely, dependent on social grants and family transfers, excluded from the dignity and social integration that employment provides. That may be the realistic assessment—fiscal constraints, administrative capacity, and political economy may simply preclude a programme of sufficient scale. But the choice should be explicit rather than the default outcome of policy drift.

### Evidence from Parliamentary Oversight

The Budgetary Review and Recommendation Reports (BRRRs) through which parliamentary portfolio committees review departmental performance—examined in full as an oversight mechanism in Chapter 3—provide the labour-market-specific evidence for that reading. Unemployment and job creation constitute the single most frequent BRRR theme across all sectors and years, generating over 400 recommendations, and the same concerns recur with dispiriting regularity: EPWP participant numbers that do not translate into sustained employment; SETA dysfunction, with training outputs disconnected from employer needs and allegations of financial mismanagement; small business support rhetoric unmatched by delivery; industrial policy incentives that fail to arrest deindustrialisation; and youth programmes reaching thousands when the crisis demands millions. When the same recommendations—improve SETA governance, link EPWP to permanent employment, streamline small business registration, enforce labour law compliance—remain substantially unimplemented year after year, the problem is not analytical but institutional: South Africa does not lack policy ideas; it lacks the state capacity and political coherence to execute them. That is, in many ways, the meta-finding of this chapter—the labour market crisis is a governance crisis expressed in employment statistics.

***

### Binding Constraints Connection

**Labour market dysfunction** is itself a binding constraint—and one profoundly shaped by all the others. The **energy crisis** (Chapter 3) directly destroyed jobs: Bhorat and Kohler (2024b) estimate that load shedding reduced employment growth by hundreds of thousands of positions. The **logistics breakdown** (Chapter 3) constrains the export-oriented sectors—agriculture (Chapter 4), mining (Chapter 5), manufacturing (Chapter 6)—that could create employment at scale. **State capacity erosion** limits the effectiveness of active labour market policies: the Employment Services of South Africa (ESSA) system reaches only a fraction of jobseekers, while the SETA system (Chapter 9) fails to connect training to employer needs. **Human capital deficits** (Chapter 9) are the deepest structural driver: 81% of Grade 4 learners cannot read for meaning, producing a workforce that lacks the capabilities employers demand—which goes some way toward explaining the paradox of mass unemployment coexisting with skills shortages. The **investment collapse** reduces labour demand directly: firms that do not invest do not hire. Addressing unemployment therefore requires action on all binding constraints simultaneously—no single intervention, whether wage subsidies, skills programmes, or regulatory reform, can succeed if the other constraints remain in place.

***

## VII. Conclusion: Towards a Jobs Compact

South Africa's unemployment crisis requires urgent, sustained coordination (National Planning Commission 2012). Three decades of intervention have not shifted fundamentals (Banerjee et al. 2008), and a generation of youth risks durable exclusion from productive employment (Graham and Mlatsheni 2015).

### Essential Elements

Any credible strategy must include (World Bank 2018; National Planning Commission 2012):

**Growth acceleration**: Higher economic growth remains a necessary if insufficient condition for job creation (Nattrass 2001). This requires addressing the binding constraints documented throughout this book—energy security, transport logistics, regulatory certainty, public sector capability. Growth alone won't solve unemployment, but without growth, nothing else can.

**Education transformation**: The education system must produce graduates with skills employers need (Spaull 2013). This means improving basic education quality, reforming TVET colleges, and creating better school-to-work transitions. Education policy should be judged partly by graduate employment outcomes, not just enrolment and completion (DHET various years).

**Labour market reforms**: The insider-outsider divide must be addressed, though how remains contested (Seekings and Nattrass 2005). Possibilities include youth wage exemptions, geographic or sectoral minimum wage variation, simplified compliance for small firms, and faster dispute resolution. Reforms should target the margin—reducing barriers to new hiring without destroying protections for current workers (Centre for Development and Enterprise various years).

**Active labour market policies at scale**: Job-matching, training, and wage subsidies can help but have remained too small and fragmented (Rankin 2020). The Presidential Youth Employment Intervention points toward coordination and scale; whether it delivers sustained employment outcomes remains to be seen (The Presidency various years).

**Informal sector enablement**: If formal employment cannot absorb all job-seekers, removing barriers to informal self-employment becomes critical (Kingdon and Knight 2004). This requires secure trading spaces, simplified registration, access to capital, and reduced crime.

### The Political Economy of Reform

Technical options exist for many labour-market failures (Centre for Development and Enterprise various years). The tighter constraint is often political: insiders with voice resist risk-bearing reforms, while outsiders with the most to gain remain weakly organised (Seekings and Nattrass 2005).

Breaking this impasse may require a broader social compact in which insiders accept some moderation of protections in exchange for credible commitments to training, placement, and social protection that benefit outsiders (National Planning Commission 2012). Such compacts have succeeded in other countries but require trust, leadership, and sustained political commitment that South Africa has struggled to generate (Habib 2013).

The alternative—persistent mass unemployment—threatens social stability and democratic legitimacy (World Bank 2018). Long-term exclusion increases susceptibility to crime, populist mobilisation, and social fragmentation. An economy with 8-12 million unemployed also struggles to sustain the growth and fiscal base needed for poverty reduction (National Treasury Budget Review various years).

South Africa's labour market crisis is thus not merely an economic challenge but an existential one. Its resolution—or lack thereof—will shape the country's trajectory for decades (Seekings and Nattrass 2005; National Planning Commission 2012).

***

{% hint style="success" %}
**Key Takeaways**

1. South Africa has the highest unemployment rate of any major economy, with 7.8 million officially unemployed (31.4%) and approximately 12.4 million under the expanded definition (the LU3 labour-underutilisation measure, 42.1%) that includes discouraged workers (Q4 2025).
2. Unemployment is structural, not cyclical, rooted in apartheid's spatial legacy, fundamental skills mismatches, and labour market institutions that protect insiders at the expense of outsiders.
3. Youth unemployment represents a generational emergency, with over 60% of 15-24 year-olds unemployed and more than 3 million young people classified as NEET (Not in Employment, Education, or Training).
4. South Africa's unusually small informal sector (18% vs 50-80% in peer countries) compounds the crisis, reflecting barriers that prevent the unemployed from creating their own work.
5. Addressing the crisis requires simultaneous action on multiple fronts: faster economic growth, education reform, labour market flexibility, active labour market policies, and informal sector enablement.
   {% endhint %}

***

## Discussion Questions

1. **Insider-outsider trade-offs**: Some argue that protecting currently employed workers (through dismissal protections, minimum wages, bargaining council extensions) reduces employment opportunities for the unemployed. Others argue that weakening protections would reduce wages without generating significant new jobs. What does the evidence suggest, and how should South Africa navigate this trade-off?
2. **The informal sector puzzle**: Why is South Africa's informal sector so small compared to peer developing countries? Is this a problem (reflecting barriers that prevent self-employment) or a success (reflecting better formal employment opportunities)? What policies might enable more productive informal employment?
3. **Youth interventions**: Evaluate the effectiveness of South Africa's youth employment programmes (ETI, YES, PYEI). What distinguishes successful youth employment interventions in other countries? How might South Africa's programmes be improved?
4. **Spatial mismatch solutions**: Apartheid's spatial planning continues to separate job-seekers from employment opportunities. What policy options—transport subsidies, housing near economic centres, bringing jobs to townships—might most effectively address this legacy? What are the trade-offs of each approach?
5. **A jobs compact**: If South Africa were to negotiate a social compact around employment—bringing together government, business, and labour—what elements should it include? What would each party need to contribute and receive for such a compact to be sustainable?

**Exercises**

1. **Unemployment Rate Calculations Using QLFS Definitions**: In Q4 2025, the working-age population (15-64) was approximately 42.1 million. Of these, 17.1 million were employed, 7.8 million were officially unemployed (actively seeking work), 3.7 million were discouraged work-seekers, and 0.9 million were other available non-searchers. Calculate: (a) the official (narrow) unemployment rate; (b) the expanded unemployment rate, now reported as the LU3 labour-underutilisation measure (which adds both discouraged work-seekers and other available non-searchers—the "potential labour force"—to the unemployed and to the labour force); (c) the labour force participation rate; (d) the absorption rate. If 500,000 discouraged workers began actively seeking work (with no change in employment), how would the official unemployment rate change? Explain why this paradoxical result creates challenges for interpreting labour market statistics.
2. **NEET Cost Estimation**: Assume 3 million young South Africans aged 18-24 are NEET. Assume each NEET youth represents foregone annual earnings of R45,000 (the approximate entry-level wage for a worker with matric). Calculate the total annual foregone output. Now add fiscal costs: if 60% of NEET youth receive the Social Relief of Distress grant (R370/month), calculate the annual transfer cost. If each NEET youth has a 20% probability of entering the criminal justice system annually at an average cost of R150,000 per case, estimate the expected annual criminal justice cost. Sum all three components to estimate the total annual economic cost of the NEET crisis. Express this as a percentage of GDP (assume GDP of approximately R7.3 trillion, 2024).
3. **Wage Gap Analysis**: The public sector wage premium over the private sector exceeds 20% for comparable positions. Average public sector earnings are approximately R28,000/month versus R22,000/month in the private sector. The public sector employs approximately 2.2 million workers. Calculate the aggregate annual wage bill difference between actual public sector wages and what they would be at private sector rates. Express this as a share of total government expenditure (approximately R2.2 trillion). If this premium were reduced by half and the savings redirected to the Employment Tax Incentive (at approximately R60,000 per additional job per year), how many additional private sector jobs could be supported? Discuss the political economy obstacles to such a reallocation.
4. **Public Employment Programme Cost-Effectiveness**: The Expanded Public Works Programme (EPWP) targets 5 million work opportunities per five-year cycle at an average daily wage of R120 for an average of 80 days per participant. Calculate the total wage bill per cycle and the annual cost. The Employment Tax Incentive costs approximately R5 billion annually for an estimated 50,000 additional permanent jobs. Compare the cost per work opportunity (EPWP) to the cost per permanent job (ETI). If EPWP participants have a 10% probability of transitioning to permanent employment after their participation, what is the effective cost per permanent job through EPWP? Which programme offers better value, and under what assumptions might the answer change?

***

## VIII. Further Reading

**Unemployment Analysis**:

* Banerjee, A. et al. "Why Has Unemployment Risen in the New South Africa?" *Economics of Transition* (2008)
* ERSA, "Rising Unemployment in Post-Apartheid South Africa: Temporary or Persistent?" (2024) — Generational decomposition of the unemployment increase.
* Zaakir Essa et al., "The Crisis of Missing Jobs in a Country Full of Work," Econ3x3 (2025) — Reframes unemployment as systemic societal failure.
* Christopher Loewald, Konstantin Makrelov, and Andreas Wörgötter, "How to Tackle Low Labour Utilisation in South Africa," Econ3x3 (2023) — Four interacting causes of low labour utilisation.
* Nattrass, N. "Jobless Growth in South Africa" *Development Southern Africa* (2011)

**Industrial Conflict and Political Economy:**

* De Kadt, Daniel, Ada Johnson-Kanu, and Melissa L. Sands. "State Violence, Party Formation, and Electoral Accountability: The Political Legacy of the Marikana Massacre." *American Political Science Review* 118(2): 563-583 (2024) — Marikana catalysed the EFF's formation and cost the ANC nine percentage points in affected communities.

**Grants and Labour Supply**:

* Cally Ardington, Anne Case, and Victoria Hosegood, "Labour Supply Responses to Large Social Transfers: Longitudinal Evidence from South Africa," *American Economic Journal: Applied Economics* 1(1): 22-48 (2009) — Landmark paper showing old age pensions *increase* labour supply of working-age household members by financing job search, contradicting the dependency narrative.

**Labour Market Institutions**:

* Bassier, I. and Budlender, J. "Minimum Wages and Monopsony in South Africa" (2024a)
* Bassier, I. "Collective Bargaining and Spillovers in Local Labour Markets," CEP Discussion Paper 1895 (2022), R\&R at *JEEA* — Wage agreements spill over to non-covered firms; cross-wage elasticity \~0.8.
* Bassier, I., Dube, A. and Naidu, S. "Monopsony in Movers" *Journal of Human Resources* (2022)
* Bassier, I. "Firms and Inequality When Unemployment is High" *Journal of Development Economics* (2023)
* Bassier, I. and Woolard, I. "Exclusive Growth? Rapidly Increasing Top Incomes Amid Low National Growth in South Africa," *South African Journal of Economics* 89(2) (2021) — Top 1% income share nearly doubled 2003-2016.
* Bhorat, H. and Kohler, T. "The Labour Market Effects of Cash Transfers to the Unemployed: Evidence from South Africa," DPRU Working Paper 202405 (2024a)
* Bhorat, H., Lilenstein, A. and Stanwix, B. "The Impact of the National Minimum Wage in South Africa: Early Quantitative Evidence," DPRU Working Paper 202104 (2021)
* Espi-Sanchis, G., Leibbrandt, M. and Ranchhod, V. "Labour Regulation in Sub-Saharan Africa," SALDRU Working Paper 308 (2024)
* Orkin, K., Woolard, I., Goldman, M. and Leibbrandt, M. "SRD Grants: How They Can Be Used to Help Young People into Jobs," Econ3x3 (2023)

**Job Search and Information Frictions**:

* Bassier, I. and Budlender, J. "Stimulus Effects of a Large Public Employment Programme," AFD Research Paper 305 (2024b) — PYEI spending stimulus of 15% with persistent effects.
* Bassier, I., Budlender, J., Zizzamia, R. and Jain, R. "The Labour Market and Poverty Impacts of COVID-19 in South Africa," *South African Journal of Economics* 91(4) (2023) — 40% employment decline in early lockdown.
* Budlender, J. and Ebrahim, A. "Estimating Employment Responses to South Africa's Employment Tax Incentive," UNU-WIDER Working Paper 2021/118 (2021) — ETI effects modest at SMEs, absent at large firms.
* Eliana Carranza, Robert Garlick, Kate Orkin, and Neil Rankin, "Job Search and Hiring with Limited Information about Workseekers' Skills," *American Economic Review* 112(11): 3547-3583 (2022) — Skills assessment and certification increases employment by 17% and earnings by 34%.
* Andrea Kiss, Robert Garlick, Kate Orkin, and Lukas Hensel, "Jobseekers' Beliefs about Comparative Advantage and (Mis)Directed Search," CSAE WP 2023-11 / R\&R *AEJ: Applied* (2024) — Correcting self-assessments redirects search and raises earnings.

**Youth Unemployment**:

* Asmal, Z., Bhorat, H., Lochmann, A., Martin, L. and Shah, K. "An Empirical Profile of South Africa's Informal Sector," DPRU Working Paper 202403 (2024)
* De Lannoy, A. et al. "Profile of Young NEETs Aged 15-24 Years in South Africa: An Annual Update," SALDRU Working Paper 298 (2023)
* Graham, L. and Mlatsheni, C. "Youth Unemployment in South Africa" *South African Child Gauge* (2015)
* Mudiriza, G., Grotte, J., De Lannoy, A., David, A. and Leibbrandt, M. "Developing a Youth Labour Market Index for South Africa at the Sub-National Level," SALDRU Working Paper 297 (2023)

**Informal Sector and Migration**:

* Kohler, T., Bhorat, H. and Hill, R. "The Effect of Wage Subsidies on Job Retention in a Developing Country: Evidence from South Africa," DPRU Working Paper (2023) — Evaluation of the TERS COVID-era wage subsidy.

**Comparative Cases**:

* Kenya Vision 2030 youth employment programmes
* India National Apprenticeship Promotion Scheme evaluations
* Rwanda VUP implementation reports

**Data Sources**:

* Department of Employment and Labour Labour Market Information System (DE-LMIS)
* SARB Quarterly Bulletin employment data
* Statistics South Africa, Quarterly Labour Force Survey

***

◀️ [Chapter 7: Services, Finance & the Digital Economy](/textbooks/the-south-african-economy/part-ii-sectors/chapter-7.md)[Chapter 9: Human Capital – Education & Health](/textbooks/the-south-african-economy/part-iii-people/chapter-9.md) ▶️